1,436
Views
17
CrossRef citations to date
0
Altmetric
Articles

Cu-Sn binary metal particle generation by spray pyrolysis

, , &
Pages 430-442 | Received 30 Jun 2016, Accepted 15 Nov 2016, Published online: 23 Dec 2016

Figures & data

Figure 1. Temperature profile of a double furnace reactor of 81.3 cm in length with (a) fixed CGFR at 3 L/min and various temperatures; (b) fixed temperature at 750°C and different CGFRs; (c) estimated residence time based on the procedures in Section 1 of the online supplementary information (SI). (d) and (e) The heating rates in the reactor with respect to the conditions in (a) and (b), respectively.
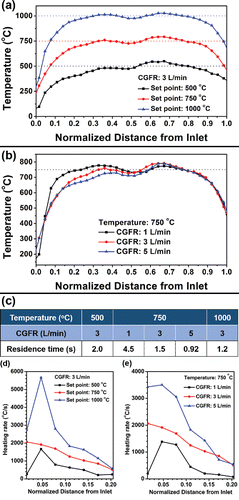
Figure 1. Temperature profile of a double furnace reactor of 81.3 cm in length with (a) fixed CGFR at 3 L/min and various temperatures; (b) fixed temperature at 750°C and different CGFRs; (c) estimated residence time based on the procedures in Section 1 of the online supplementary information (SI). (d) and (e) The heating rates in the reactor with respect to the conditions in (a) and (b), respectively.

Figure 2. XRD results of powders generated from systematic conditions. The precursor contained 1 M Cu(NO3)2, 0.1 M SnCl2, 0.1 M HNO3, and 4.8 M EG. The CGFR was fixed at 3 L/min. The powders were generated at 500°C, 750°C, and 1000°C. The major peaks are from Cu13.7Sn (ICDD with PDF No. 03-065-6821) and Cu (ICDD PDF No. 01-070-3038).
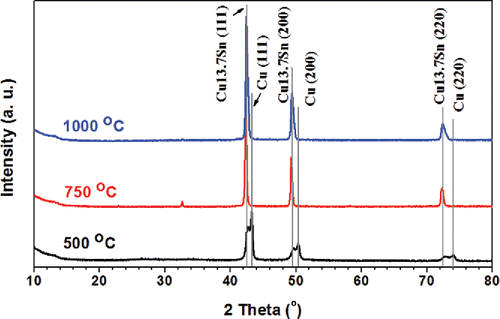
Figure 2. XRD results of powders generated from systematic conditions. The precursor contained 1 M Cu(NO3)2, 0.1 M SnCl2, 0.1 M HNO3, and 4.8 M EG. The CGFR was fixed at 3 L/min. The powders were generated at 500°C, 750°C, and 1000°C. The major peaks are from Cu13.7Sn (ICDD with PDF No. 03-065-6821) and Cu (ICDD PDF No. 01-070-3038).

Figure 3. SEM images of powders generated from the precursor solution with 1 M Cu(NO3)2, 0.1 M SnCl2, 0.1 M HNO3, and 4.8 M EG. The reaction temperatures were 500°C (a), 750°C (b), and 1000°C (c). The CGFR was fixed at 3 L/min. Insets are higher magnification images of selected regions marked by solid arrows. The scale bars in all figures are 1 μm. (d) The summary of the diameter of the particles marked as 1, 2, and 3 in (a)–(c). Detailed size distributions for each condition can be found in Figure S5 (in the SI).
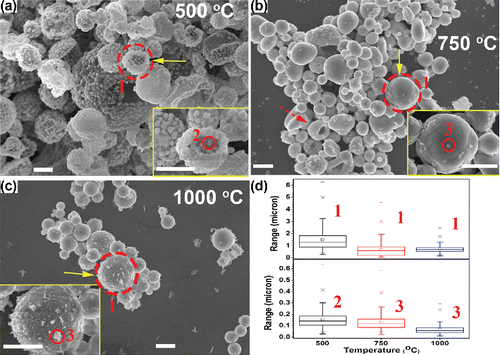
Figure 3. SEM images of powders generated from the precursor solution with 1 M Cu(NO3)2, 0.1 M SnCl2, 0.1 M HNO3, and 4.8 M EG. The reaction temperatures were 500°C (a), 750°C (b), and 1000°C (c). The CGFR was fixed at 3 L/min. Insets are higher magnification images of selected regions marked by solid arrows. The scale bars in all figures are 1 μm. (d) The summary of the diameter of the particles marked as 1, 2, and 3 in (a)–(c). Detailed size distributions for each condition can be found in Figure S5 (in the SI).

Figure 4. TEM images of particles fabricated by precursors with 1 M Cu(NO3)2, 0.1 M SnCl2, and 0.1 M HNO3. The CGFR was fixed at 3 L/min. (a)–(b) Particles generated at 500°C, with 5.9 M EG. (c)–(d) Particles obtained at 750°C, with 4.8 M EG. (e)–(f) Particles obtained at 1000°C, with 4.8 M EG.
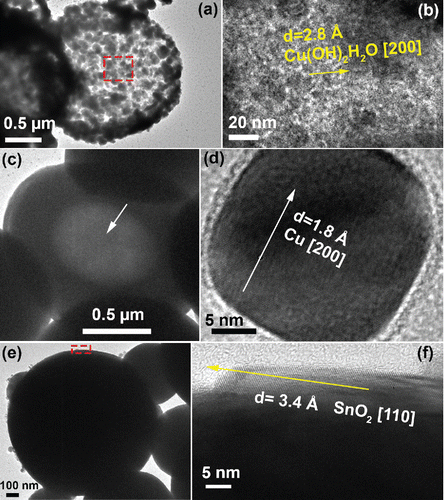
Figure 4. TEM images of particles fabricated by precursors with 1 M Cu(NO3)2, 0.1 M SnCl2, and 0.1 M HNO3. The CGFR was fixed at 3 L/min. (a)–(b) Particles generated at 500°C, with 5.9 M EG. (c)–(d) Particles obtained at 750°C, with 4.8 M EG. (e)–(f) Particles obtained at 1000°C, with 4.8 M EG.

Figure 5. The Cu/Sn ratios summarized from XPS results (Section 3 in the SI). The precursor contained 1 M Cu(NO3)2, 0.1 M SnCl2, 0.1 M HNO3, and 4.8 M EG. The CGFR was set at 3 L/min. Sputtering was conducted in vacuum by argon ions for 20 min.
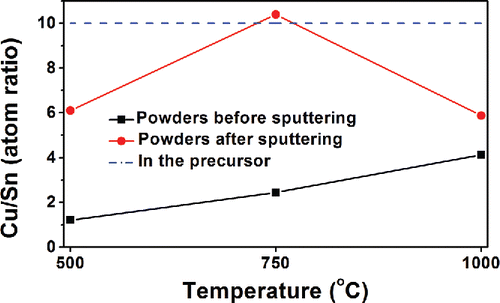
Figure 5. The Cu/Sn ratios summarized from XPS results (Section 3 in the SI). The precursor contained 1 M Cu(NO3)2, 0.1 M SnCl2, 0.1 M HNO3, and 4.8 M EG. The CGFR was set at 3 L/min. Sputtering was conducted in vacuum by argon ions for 20 min.

Figure 6. SEM images of powders obtained at 750°C from precursors with 1 M Cu(NO3)2, 0.1 M SnCl2, 0.1 M HNO3, and 4.8 M EG. The residence times are: 4.5 s (a), 1.5 s (b), and 0.92 s (c). The insets of each figure are higher magnification images of the area marked by arrows. Arrows show irregular structures. (d) The XRD results of the powders obtained at the conditions of (a)–(c). The peaks are attributed to Cu13.7Sn (ICDD with PDF No. 03-065-6821). All scale bars in the SEM images are 1 μm.
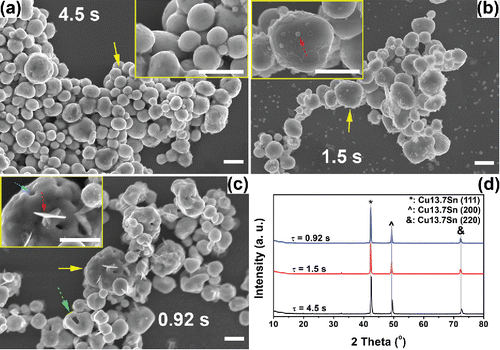
Figure 6. SEM images of powders obtained at 750°C from precursors with 1 M Cu(NO3)2, 0.1 M SnCl2, 0.1 M HNO3, and 4.8 M EG. The residence times are: 4.5 s (a), 1.5 s (b), and 0.92 s (c). The insets of each figure are higher magnification images of the area marked by arrows. Arrows show irregular structures. (d) The XRD results of the powders obtained at the conditions of (a)–(c). The peaks are attributed to Cu13.7Sn (ICDD with PDF No. 03-065-6821). All scale bars in the SEM images are 1 μm.

Figure 7. The effect of quench gas on the morphologies and crystallinities of the powders obtained at 1000°C. The precursors contained 1 M Cu(NO3)2, 0.1 M HNO3, and 4.8 M EG. The SnCl2 concentration was 0.05 M (a)–(b) and 0.1 M (c)–(d). SEM images of the prepared powders are shown in (a), (c) with quench gas, and (b), (d) without quench gas. (e) The XRD results of the generated powders at the four conditions. Standard peaks from Cu13.7Sn, (Cu32Sn) 0.12, and Cu are displayed below the XRD results for reference. Scale bars in the SEM images are 1 μm.
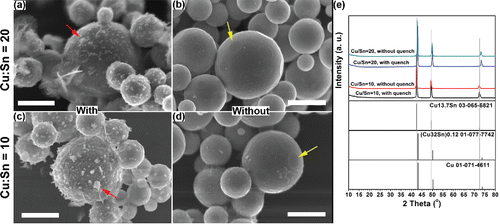
Figure 7. The effect of quench gas on the morphologies and crystallinities of the powders obtained at 1000°C. The precursors contained 1 M Cu(NO3)2, 0.1 M HNO3, and 4.8 M EG. The SnCl2 concentration was 0.05 M (a)–(b) and 0.1 M (c)–(d). SEM images of the prepared powders are shown in (a), (c) with quench gas, and (b), (d) without quench gas. (e) The XRD results of the generated powders at the four conditions. Standard peaks from Cu13.7Sn, (Cu32Sn) 0.12, and Cu are displayed below the XRD results for reference. Scale bars in the SEM images are 1 μm.

Figure 8. Schematic illustration of the proposed Cu-Sn binary particle formation process. The circle in Step (Equation1) represents the precursor droplet. The magnified image of the Step (Equation1) product illustrate the Cu-Sn solid solution and the metallic copper, respectively. The small circles are the metal particles formed by gas-to-particle conversion.

Figure 8. Schematic illustration of the proposed Cu-Sn binary particle formation process. The circle in Step (Equation1[1] ) represents the precursor droplet. The magnified image of the Step (Equation1[1] ) product illustrate the Cu-Sn solid solution and the metallic copper, respectively. The small circles are the metal particles formed by gas-to-particle conversion.
Supplemental material

UAST_1265912_Supplemental_File.zip

Download Zip (2.1 MB)

Reprints and Corporate Permissions

Please note: Selecting permissions does not provide access to the full text of the article, please see our help page How do I view content?

To request a reprint or corporate permissions for this article, please click on the relevant link below:

Academic Permissions

Please note: Selecting permissions does not provide access to the full text of the article, please see our help page How do I view content?

Obtain permissions instantly via Rightslink by clicking on the button below:

If you are unable to obtain permissions via Rightslink, please complete and submit this Permissions form. For more information, please visit our Permissions help page.