Figures & data
Figure 1. Views from three different angles of the soot particle aggregates for N = 200 particles (dp = 40 nm, aeff = 0.11696 μm, Df = 2.1, kf = 2.3, Cov = 0.0, α = 0.0) before atmospheric aging.
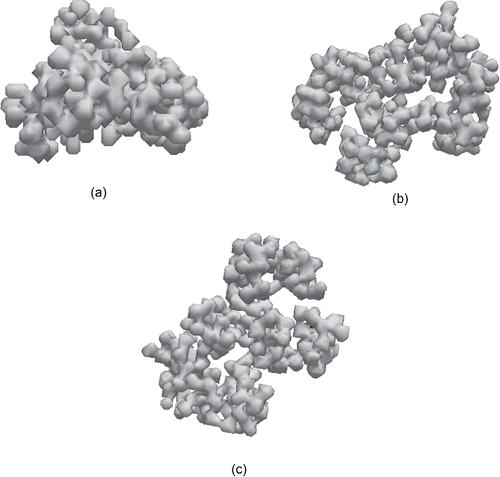
Figure 2. Comparison between the volume equivalent radii of coated aggregates for α range of 0.25–0.5: (a) for Cov = 0.002, (b) for Cov = 0.01, (c) for Cov = 0.05, and (d) for Cov = 0.1.
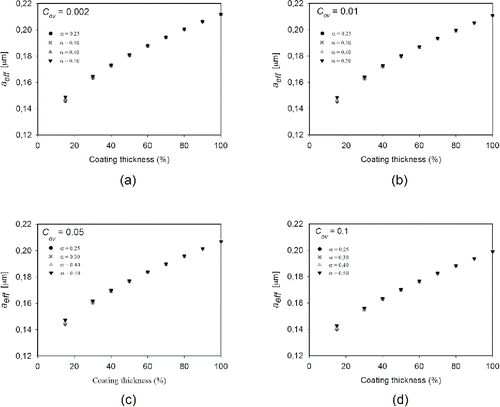
Table 1. The volume equivalent radius values of uncoated aggregates for different overlapping and necking.
Figure 3. TEM images of changes in morphology: (a) fresh soot; (b) coated soot (Qiu et al. Citation2012); (c) a typical chain-like soot aggregate; the arrows point to a carbon film that connects individual spherules within the aggregate (Pósfai et al. Citation1999); (d) particles containing KCl and K2SO4, whose emissions from biomass-burning take up water at 83% (Freney et al. Citation2010); (e) particles collected from an inland area and exposed to humidity (Freney et al. Citation2010).
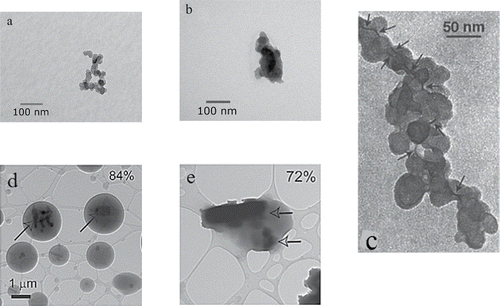
Figure 4. Comparison of the absorption cross-sections at different overlapping values for uncoated and coated soot aggregates.
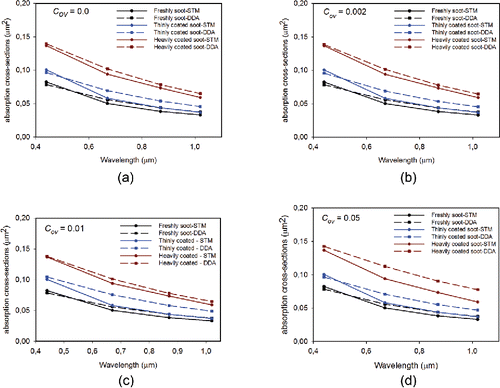
Table 2. Values of relative difference of the calculations of DDA for small overlapping cases.
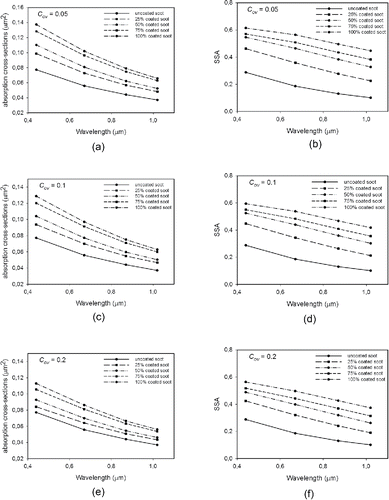
Figure 5. Comparisons of the absorption cross-sections and single scattering albedos for the small overlapping case for coated soot aggregates, respectively, in (a) and (b) for Cov = 0.05, (c) and (d) for Cov = 0.1, (e) and (f) for Cov = 0.2.