1,679
Views
15
CrossRef citations to date
0
Altmetric
Articles

Role of oleic acid coating in the heterogeneous uptake of dimethylamine by ammonium sulfate particles

ORCID Icon & ORCID Icon
Pages 988-997 | Received 19 Feb 2017, Accepted 19 Apr 2017, Published online: 08 May 2017

Figures & data

Table 1. Summary of experimental conditions and NH4+ displacement percentages.

Figure 1. Particle mass changes of AS particles coated with fresh or aged OA at 60% RH. The color scale indicates the mass fraction (on a dry basis) of organic coating. Online color: Open circles—particles coated with fresh OA: light green—experiment #1 (in , same as below); dark green—experiment #2; red—experiment #3; blue—experiment #4. Solid circles—particles coated with mildly aged (1 ppm ozone, 1 h of processing) OA prior to DMA uptake: dark green – experiment #5; red – experiment #6; purple - experiment #7. Solid squares—particles coated with intensively aged (2 ppm ozone, 12 h of processing) OA prior to DMA uptake: dark green—experiment #8; red—experiment #9; purple—experiment #10. Experimental uncertainties are not shown because they are masked by the symbols.
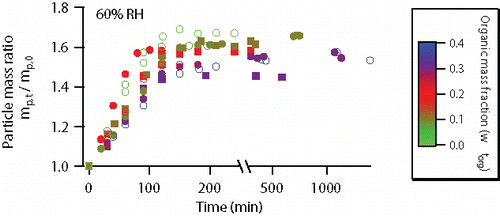
Figure 1. Particle mass changes of AS particles coated with fresh or aged OA at 60% RH. The color scale indicates the mass fraction (on a dry basis) of organic coating. Online color: Open circles—particles coated with fresh OA: light green—experiment #1 (in Table 1, same as below); dark green—experiment #2; red—experiment #3; blue—experiment #4. Solid circles—particles coated with mildly aged (1 ppm ozone, 1 h of processing) OA prior to DMA uptake: dark green – experiment #5; red – experiment #6; purple - experiment #7. Solid squares—particles coated with intensively aged (2 ppm ozone, 12 h of processing) OA prior to DMA uptake: dark green—experiment #8; red—experiment #9; purple—experiment #10. Experimental uncertainties are not shown because they are masked by the symbols.

Figure 2. Particle mass changes of AS particles coated with fresh or aged OA at 30% RH. The color scale indicates the mass fraction (on a dry basis) of organic coating. Online color: Open circles—particles coated with fresh OA: light green—experiment #11 (in , same as below); dark green—experiment #12; red—experiment #13. Solid circles—particles coated with mildly aged (1 ppm ozone, 1 h of processing) OA prior to DMA uptake: light green—experiment #14; red—experiment #15; blue—experiment #16. Solid squares—particles coated with intensively aged (2 ppm ozone, 12 h of processing) OA prior to DMA uptake: dark green—experiment #17; purple—experiment #18. Experimental uncertainties are not shown because they are masked by the symbols.
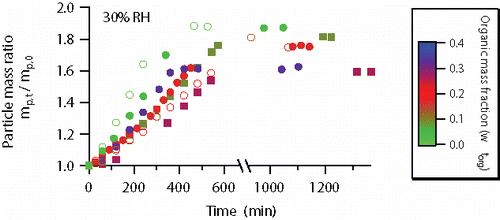
Figure 2. Particle mass changes of AS particles coated with fresh or aged OA at 30% RH. The color scale indicates the mass fraction (on a dry basis) of organic coating. Online color: Open circles—particles coated with fresh OA: light green—experiment #11 (in Table 1, same as below); dark green—experiment #12; red—experiment #13. Solid circles—particles coated with mildly aged (1 ppm ozone, 1 h of processing) OA prior to DMA uptake: light green—experiment #14; red—experiment #15; blue—experiment #16. Solid squares—particles coated with intensively aged (2 ppm ozone, 12 h of processing) OA prior to DMA uptake: dark green—experiment #17; purple—experiment #18. Experimental uncertainties are not shown because they are masked by the symbols.

Figure 3. Particle mass changes of AS particles coated with fresh or aged OA at <5% RH. The color scale indicates the mass fraction (on a dry basis) of organic coating. Online color: Open circles—particles coated with fresh OA: light green—experiment #19 (in , same as below); dark green—experiment #20; purple—experiment #21. Solid circles—particles coated with mildly aged (1 ppm ozone, 1 h of processing) OA prior to DMA uptake: dark green—experiment #22; red—experiment #23; blue—experiment #24. Experimental uncertainties are shown in error bars unless they are covered by the symbols.
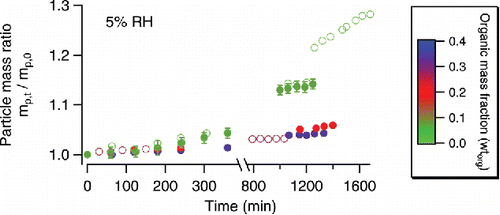
Figure 3. Particle mass changes of AS particles coated with fresh or aged OA at <5% RH. The color scale indicates the mass fraction (on a dry basis) of organic coating. Online color: Open circles—particles coated with fresh OA: light green—experiment #19 (in Table 1, same as below); dark green—experiment #20; purple—experiment #21. Solid circles—particles coated with mildly aged (1 ppm ozone, 1 h of processing) OA prior to DMA uptake: dark green—experiment #22; red—experiment #23; blue—experiment #24. Experimental uncertainties are shown in error bars unless they are covered by the symbols.

Figure 4. Raman spectral changes during (a) OA coating and aging under dry conditions and (b) DMA uptake at 30% RH.
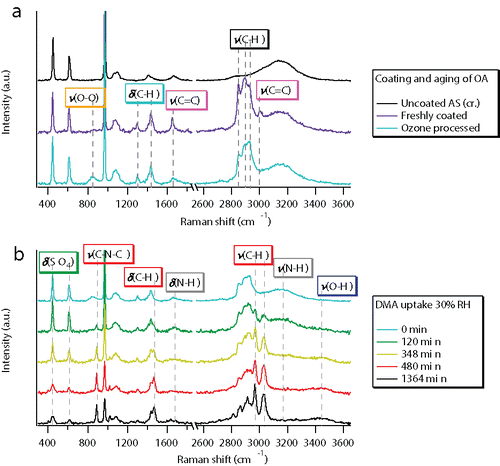
Figure 4. Raman spectral changes during (a) OA coating and aging under dry conditions and (b) DMA uptake at 30% RH.

Figure 5. Measured DMA uptake coefficients at (a) 60% RH, (b) 30% RH, and (c) <5% RH against mass fractions of organic coating (on a dry basis). Open black circles—particles coated with fresh OA; solid black circles—particles coated with mildly aged OA with 1 ppm ozone processing for 1 h prior to DMA uptake; solid grey squares—particles coated with intensively aged OA with 2 ppm ozone processing for 12 h prior to DMA uptake.
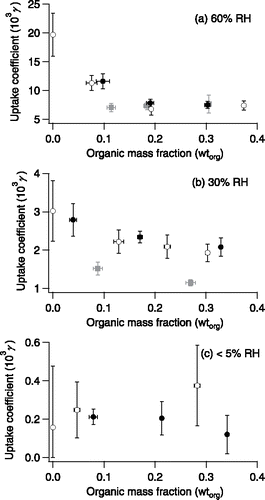
Figure 5. Measured DMA uptake coefficients at (a) 60% RH, (b) 30% RH, and (c) <5% RH against mass fractions of organic coating (on a dry basis). Open black circles—particles coated with fresh OA; solid black circles—particles coated with mildly aged OA with 1 ppm ozone processing for 1 h prior to DMA uptake; solid grey squares—particles coated with intensively aged OA with 2 ppm ozone processing for 12 h prior to DMA uptake.

Figure 6. Raman spectral intensities of AS particles coated with fresh or aged OA along the vertical direction. The Raman spectra were taken at 60% RH. The wtorg values (on a dry basis) are shown in the figure as annotations. The Z pixel represents the relative vertical position within the particle. The black bars indicate the top and bottom boundaries of the particle. The microscopic images of the particles are shown in the top right corner. One unit of the scale corresponds to a length of 20 μm.
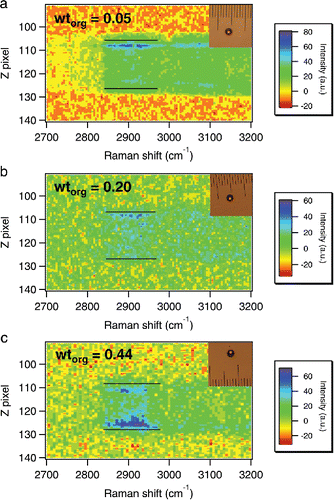
Figure 6. Raman spectral intensities of AS particles coated with fresh or aged OA along the vertical direction. The Raman spectra were taken at 60% RH. The wtorg values (on a dry basis) are shown in the figure as annotations. The Z pixel represents the relative vertical position within the particle. The black bars indicate the top and bottom boundaries of the particle. The microscopic images of the particles are shown in the top right corner. One unit of the scale corresponds to a length of 20 μm.
Supplemental material

UAST_1323072_Supplemental_file.zip

Download Zip (113 KB)

Reprints and Corporate Permissions

Please note: Selecting permissions does not provide access to the full text of the article, please see our help page How do I view content?

To request a reprint or corporate permissions for this article, please click on the relevant link below:

Academic Permissions

Please note: Selecting permissions does not provide access to the full text of the article, please see our help page How do I view content?

Obtain permissions instantly via Rightslink by clicking on the button below:

If you are unable to obtain permissions via Rightslink, please complete and submit this Permissions form. For more information, please visit our Permissions help page.