1,866
Views
7
CrossRef citations to date
0
Altmetric
Articles

Particle size and chemical composition effects on elemental analysis with the nano aerosol mass spectrometer

, &
Pages 1135-1143 | Received 17 Feb 2017, Accepted 17 May 2017, Published online: 14 Jun 2017

Figures & data

Figure 1. NAMS platform for analyzing particles between 40 and 150 nm in diameter.

Figure 1. NAMS platform for analyzing particles between 40 and 150 nm in diameter.

Figure 2. Summary of sucrose charge state distributions in single particle mass spectra from four monodisperse aerosol datasets, 100 spectra each. For each mass spectrum, the percentage of total signal intensity attributed to multiply charged atomic ions was calculated, and the data were sorted from highest percentage on the left to lowest percentage on the right.
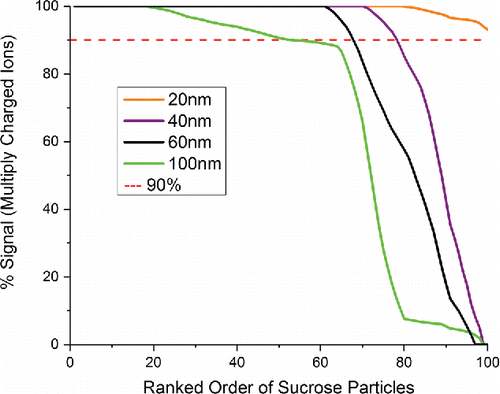
Figure 2. Summary of sucrose charge state distributions in single particle mass spectra from four monodisperse aerosol datasets, 100 spectra each. For each mass spectrum, the percentage of total signal intensity attributed to multiply charged atomic ions was calculated, and the data were sorted from highest percentage on the left to lowest percentage on the right.

Table 1. Measured O/C ratios for monodisperse sucrose aerosols using two different quantification methods. Measurement uncertainties are reported as 1 standard deviation. (Expected O/C ratio is 0.917).

Figure 3. Average mass spectrum of 100 particles from a polydisperse aerosol composed of a 2:1 molar ratio HEPES and cesium iodide. Measurement uncertainties are reported as 1 standard deviation. Atomic ions from the various elements are marked by the bars above the spectrum.
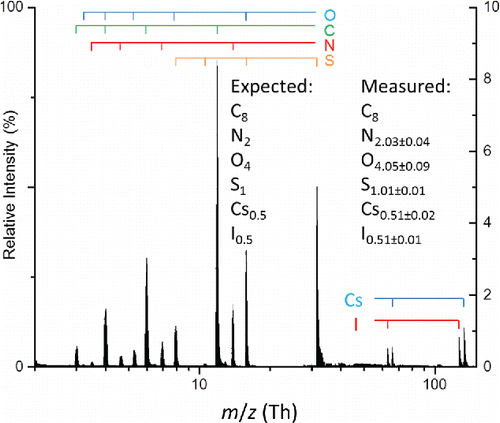
Figure 3. Average mass spectrum of 100 particles from a polydisperse aerosol composed of a 2:1 molar ratio HEPES and cesium iodide. Measurement uncertainties are reported as 1 standard deviation. Atomic ions from the various elements are marked by the bars above the spectrum.
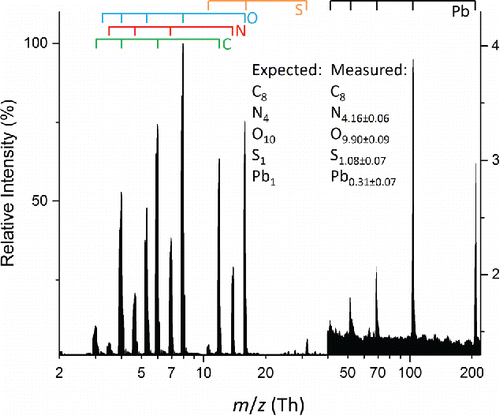
Table 2. Expected and measured elemental mole ratios from aerosols composed of HEPES and cesium iodide.

Figure 4. Average mass spectrum of 100 particles from a polydisperse aerosol composed of a 1:1 molar ratio lead(II) nitrate and HEPES. Measurement uncertainties are reported as 1 standard deviation. Atomic ions from the various elements are marked by the bars above the spectrum.
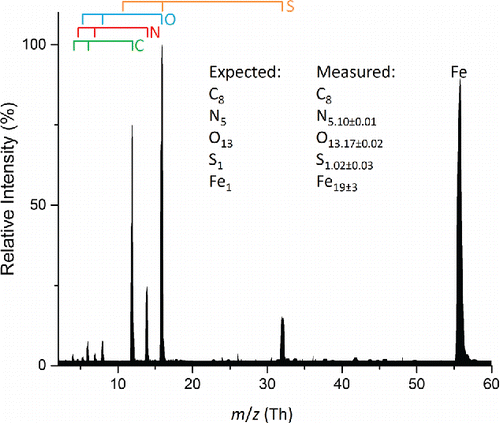
Figure 4. Average mass spectrum of 100 particles from a polydisperse aerosol composed of a 1:1 molar ratio lead(II) nitrate and HEPES. Measurement uncertainties are reported as 1 standard deviation. Atomic ions from the various elements are marked by the bars above the spectrum.
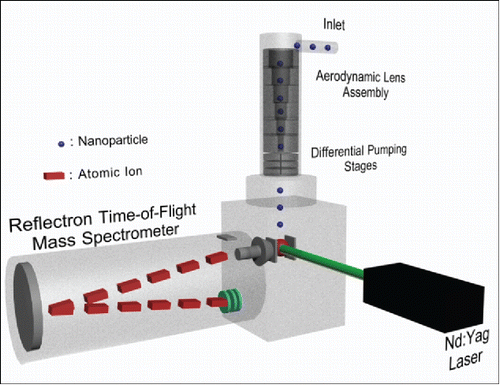
Figure 5. Average mass spectrum of 100 particles from a polydisperse aerosol composed of a 1:1 molar ratio iron(III) nitrate and HEPES. Measurement uncertainties are reported as 1 standard deviation. Atomic ions from the various elements are marked by the bars above the spectrum.
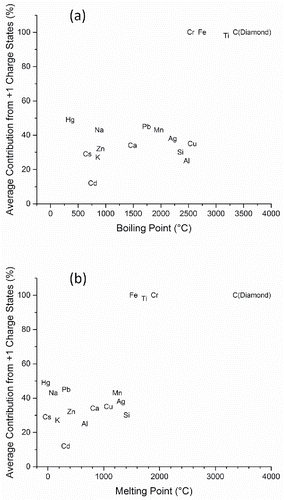
Figure 5. Average mass spectrum of 100 particles from a polydisperse aerosol composed of a 1:1 molar ratio iron(III) nitrate and HEPES. Measurement uncertainties are reported as 1 standard deviation. Atomic ions from the various elements are marked by the bars above the spectrum.
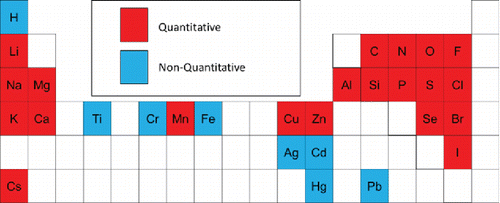
Figure 6. Plot of percentage of total signal intensity attributed to singly charged ions in the average mass spectrum of aerosol containing a specific element vs. (a) boiling point and (b) melting point of that element.

Figure 6. Plot of percentage of total signal intensity attributed to singly charged ions in the average mass spectrum of aerosol containing a specific element vs. (a) boiling point and (b) melting point of that element.

Figure 7. Elements for which quantitative analysis is/is not possible by LIPI under the conditions used in this study.

Figure 7. Elements for which quantitative analysis is/is not possible by LIPI under the conditions used in this study.
Supplemental material

UAST_1335390_Supplementary_File.zip

Download Zip (222.4 KB)

Reprints and Corporate Permissions

Please note: Selecting permissions does not provide access to the full text of the article, please see our help page How do I view content?

To request a reprint or corporate permissions for this article, please click on the relevant link below:

Academic Permissions

Please note: Selecting permissions does not provide access to the full text of the article, please see our help page How do I view content?

Obtain permissions instantly via Rightslink by clicking on the button below:

If you are unable to obtain permissions via Rightslink, please complete and submit this Permissions form. For more information, please visit our Permissions help page.