921
Views
0
CrossRef citations to date
0
Altmetric
Articles

Visualization of submicron aerosol agglomeration by laser-induced fluorescence

, , &
Pages 1093-1098 | Received 17 Feb 2017, Accepted 12 May 2017, Published online: 05 Jul 2017

Figures & data

Figure 1. (a) Schematic view of two spherical particles barely touching each other, used for estimation of the characteristic diffusion time τdiff. (b) Morphologies illustrate how the mass transfer surface between two agglomerating particles increases, depending on the contact angle θ.

Figure 1. (a) Schematic view of two spherical particles barely touching each other, used for estimation of the characteristic diffusion time τdiff. (b) Morphologies illustrate how the mass transfer surface between two agglomerating particles increases, depending on the contact angle θ.

Figure 2. Experimental setup. Dimensions in mm.

Figure 2. Experimental setup. Dimensions in mm.

Figure 3. Top view on duct shows four different snapshots of the agglomeration zone at about 80 mm from the end of the flow separation wall with an expanded laser beam. Flow direction is from top to bottom. The two upper images show that there is only little fluorescence due to agglomeration when only one charger is active. The bottom images show that agglomeration is greatly enhanced when both chargers are active. The width of the laser beam in flow direction is 20 mm. The patterns on both sides originate from laser light scattered by the sidewalls of the duct and only designate the duct boundary (see the SI).
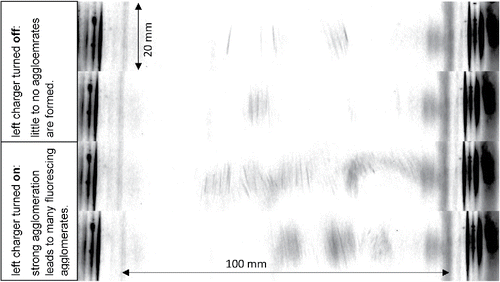
Figure 3. Top view on duct shows four different snapshots of the agglomeration zone at about 80 mm from the end of the flow separation wall with an expanded laser beam. Flow direction is from top to bottom. The two upper images show that there is only little fluorescence due to agglomeration when only one charger is active. The bottom images show that agglomeration is greatly enhanced when both chargers are active. The width of the laser beam in flow direction is 20 mm. The patterns on both sides originate from laser light scattered by the sidewalls of the duct and only designate the duct boundary (see the SI).
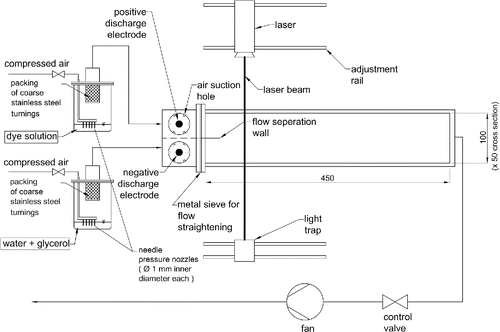
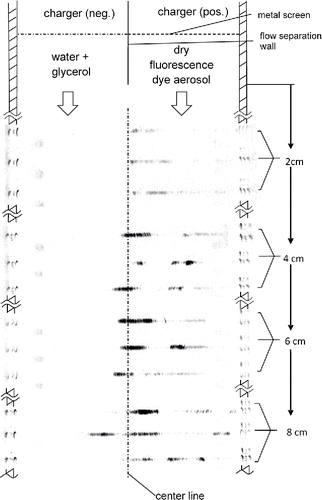
Figure 4. Agglomeration zones from top view of agglomeration duct at different distances from the flow separation wall. The black areas show where agglomeration occurs. An unexpanded Laser beam of 532 nm wavelength was used to illuminate the tracer Rhodamine B.

Figure 4. Agglomeration zones from top view of agglomeration duct at different distances from the flow separation wall. The black areas show where agglomeration occurs. An unexpanded Laser beam of 532 nm wavelength was used to illuminate the tracer Rhodamine B.
Supplemental material

UAST_1339863_Supplemental_File.zip

Download Zip (13.2 MB)

Reprints and Corporate Permissions

Please note: Selecting permissions does not provide access to the full text of the article, please see our help page How do I view content?

To request a reprint or corporate permissions for this article, please click on the relevant link below:

Academic Permissions

Please note: Selecting permissions does not provide access to the full text of the article, please see our help page How do I view content?

Obtain permissions instantly via Rightslink by clicking on the button below:

If you are unable to obtain permissions via Rightslink, please complete and submit this Permissions form. For more information, please visit our Permissions help page.