1,786
Views
16
CrossRef citations to date
0
Altmetric
Laser-Induced Incandescence for Particle Measurements: Knowledge Gaps, Measurement Artifacts, and New Approaches

Planar 2-color time-resolved laser-induced incandescence measurements of soot in a diffusion flame

ORCID Icon, , &
Pages 1345-1353 | Received 23 Feb 2017, Accepted 29 Jul 2017, Published online: 11 Oct 2017

Figures & data

Figure 1. Schematic of 2D-2C-TiRe-LII measurement set-up (B1: 400 ± 5nm band filter; NB2: 450 ± 5 nm band filter).
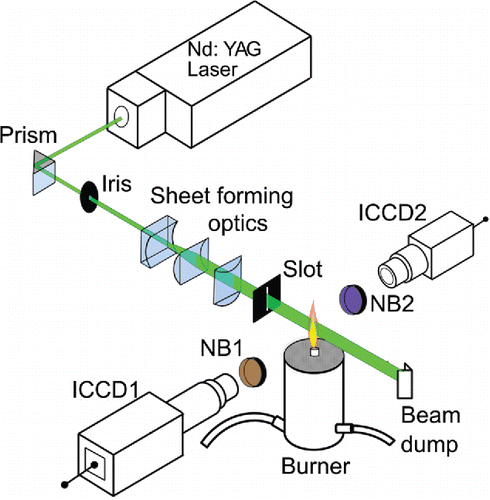
Figure 1. Schematic of 2D-2C-TiRe-LII measurement set-up (B1: 400 ± 5nm band filter; NB2: 450 ± 5 nm band filter).

Figure 2. Temporal evolution of the LII signal at 400 nm and 450 nm. Interval start times are marked in each image.
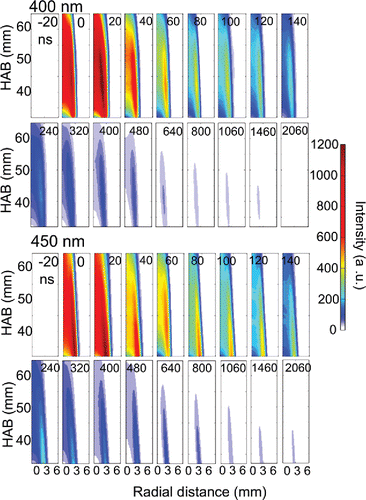
Figure 2. Temporal evolution of the LII signal at 400 nm and 450 nm. Interval start times are marked in each image.

Figure 3. Colour maps of the maximum likelihood estimators χ2 value as a function of the distribution width σ, and the median diameter Dm for location A: HAB = 38 nm and r = 2.2 mm and B: HAB = 42 mm and r = 0 mm. The best fit value is shown in each figure.
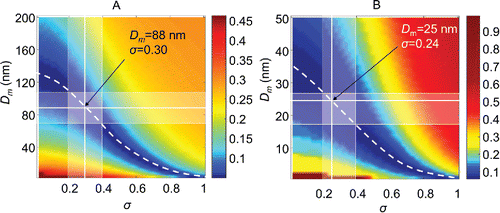
Figure 3. Colour maps of the maximum likelihood estimators χ2 value as a function of the distribution width σ, and the median diameter Dm for location A: HAB = 38 nm and r = 2.2 mm and B: HAB = 42 mm and r = 0 mm. The best fit value is shown in each figure.

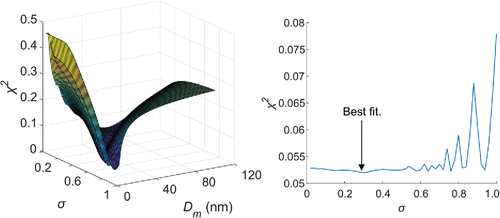
Figure 4. Left: 3D plot of χ2 for location A; right: value of the minimised χ2 along the valley.

Figure 4. Left: 3D plot of χ2 for location A; right: value of the minimised χ2 along the valley.

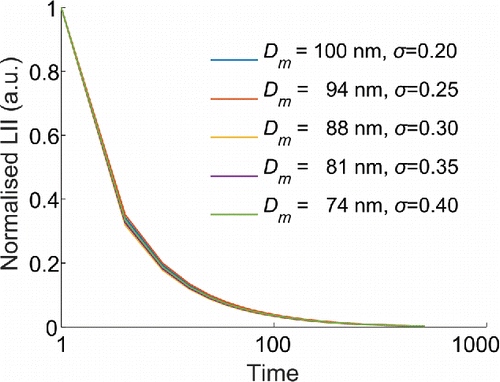
Figure 5. Reconstructed LII signal with selected (Dm, σ) pairs in the valley of minimising values.

Figure 5. Reconstructed LII signal with selected (Dm, σ) pairs in the valley of minimising values.

Table 1. Best-fit value and range of and σ at locations A and B.

Figure 6. Normalised LII signal at 400 nm as a function of time at flame locations A and B. The best fit of experimental LII signals at the two different locations was found by 2-parameter fitting.
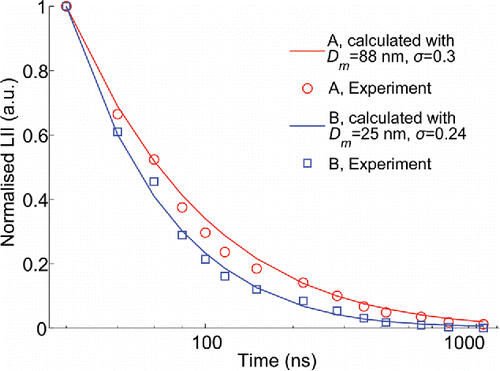
Figure 6. Normalised LII signal at 400 nm as a function of time at flame locations A and B. The best fit of experimental LII signals at the two different locations was found by 2-parameter fitting.

Figure 7. Measured LII signal at 400 nm (blue symbols, right scale), model LII using minimum error method for mean diameter and its distribution, as well as 2C method for peak temperature (solid blue line). Measured particle temperature T (red squares, left scale) using the two colour method; modelled T starting from the 2C peak measurement Tp = 3181 K.
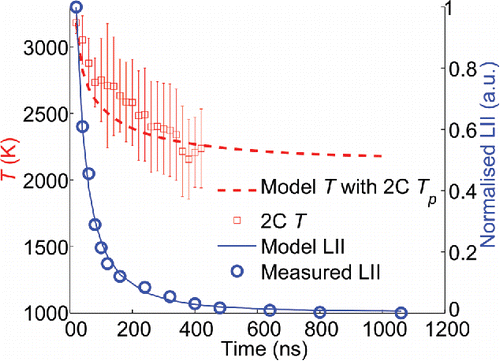
Figure 7. Measured LII signal at 400 nm (blue symbols, right scale), model LII using minimum error method for mean diameter and its distribution, as well as 2C method for peak temperature (solid blue line). Measured particle temperature T (red squares, left scale) using the two colour method; modelled T starting from the 2C peak measurement Tp = 3181 K.

Figure 8. Calculated Tp with the 2C method (left); estimated Dm with the 2-parameter fit (middle); measured fv in the tested flame (right) (Tian et al., Citation2015).
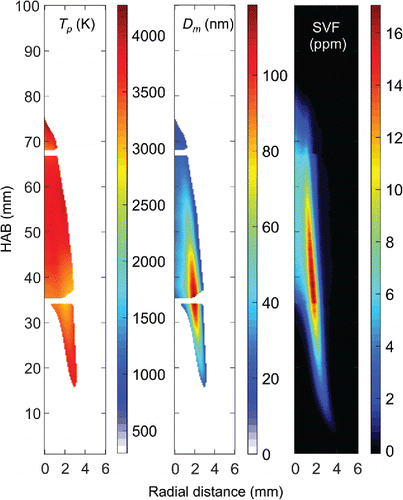
Figure 8. Calculated Tp with the 2C method (left); estimated Dm with the 2-parameter fit (middle); measured fv in the tested flame (right) (Tian et al., Citation2015).

Figure 9. Top: Calculated particle temperature using 2C peak temperature Tp (dashed line) and full energy model (solid line) at HAB = 42 mm and r = 0 mm. Bottom: Corresponding normalised measured LII signal (symbols), modelled signal calculated from 2C TP and optimal Dm = 25 nm and σ = 0.24 (dashed line); full energy model T and optimal Dm = 34 nm and σ = 0.3 (solid line).
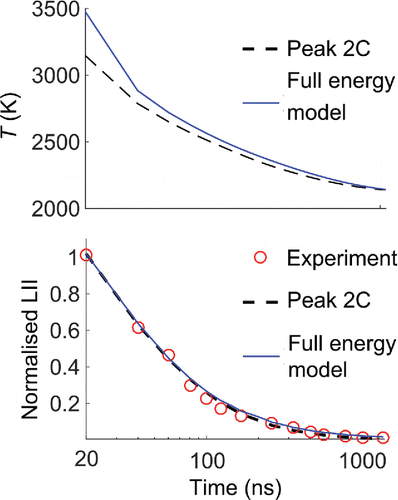
Figure 9. Top: Calculated particle temperature using 2C peak temperature Tp (dashed line) and full energy model (solid line) at HAB = 42 mm and r = 0 mm. Bottom: Corresponding normalised measured LII signal (symbols), modelled signal calculated from 2C TP and optimal Dm = 25 nm and σ = 0.24 (dashed line); full energy model T and optimal Dm = 34 nm and σ = 0.3 (solid line).

Figure 10. Sensitivity of the particle-size evaluation on the peak temperature Tp. The baseline values of the particle size and peak temperature are estimated as 40 nm and 3133 K, respectively.
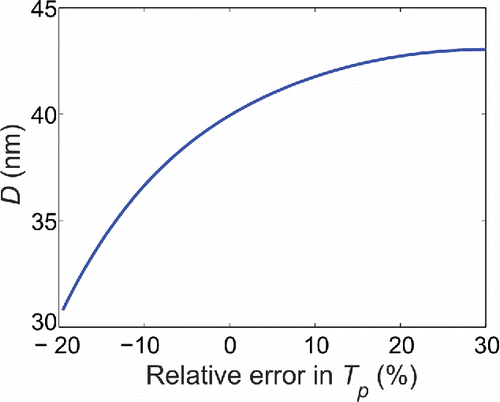
Figure 10. Sensitivity of the particle-size evaluation on the peak temperature Tp. The baseline values of the particle size and peak temperature are estimated as 40 nm and 3133 K, respectively.
Supplemental material

UAST 1366644 Supplementary Materials.zip

Download Zip (8.1 MB)