720
Views
14
CrossRef citations to date
0
Altmetric
Laser-Induced Incandescence for Particle Measurements: Knowledge Gaps, Measurement Artifacts, and New Approaches

Investigations of the long-term effects of LII on soot and bath gas

, &
Pages 1354-1367 | Received 11 Jan 2017, Accepted 29 Jul 2017, Published online: 29 Sep 2017

Figures & data

Figure 1. Illustration of the experimental set-up. Soot was generated using a Santoro burner under atmospheric conditions. An Nd:YAG laser (1064 nm) was used to irradiate the soot. The laser was first passed through a horizontal slit and then imaged to the flame at 50 mm HAB. A He-Ne laser at 633 nm was used to perform laser extinction measurements. The signal was collected using a photodiode and measured with an oscilloscope. An ICCD camera was used to perform two color pyrometery and a high-speed camera was used to image the flame during TEM sampling (not shown) and to obtain signal intensity measurements.
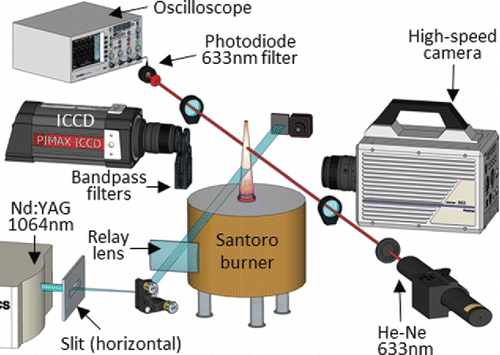
Figure 1. Illustration of the experimental set-up. Soot was generated using a Santoro burner under atmospheric conditions. An Nd:YAG laser (1064 nm) was used to irradiate the soot. The laser was first passed through a horizontal slit and then imaged to the flame at 50 mm HAB. A He-Ne laser at 633 nm was used to perform laser extinction measurements. The signal was collected using a photodiode and measured with an oscilloscope. An ICCD camera was used to perform two color pyrometery and a high-speed camera was used to image the flame during TEM sampling (not shown) and to obtain signal intensity measurements.

Figure 2. Energy distribution of the horizontal laser sheet. The intensity maps shown above and to the right of each laser profile are the normalized average of each row and column of the laser sheet respectively. The laser region of interest (location where the laser hits the flame) is at ± 3 mm in the horizontal direction. In the vertical direction, the laser sheet has a quasi-top hat laser profile approximately 2 mm thick.
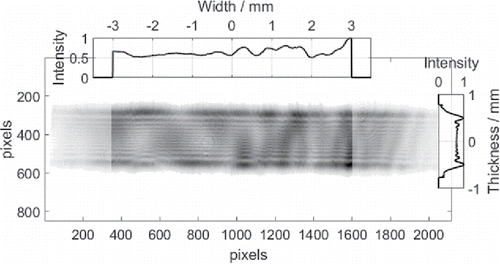
Figure 2. Energy distribution of the horizontal laser sheet. The intensity maps shown above and to the right of each laser profile are the normalized average of each row and column of the laser sheet respectively. The laser region of interest (location where the laser hits the flame) is at ± 3 mm in the horizontal direction. In the vertical direction, the laser sheet has a quasi-top hat laser profile approximately 2 mm thick.

Figure 3. Thermophoretic soot sampling was performed using a single action pneumatic piston to insert a TEM grid. High precision tweezers were used to hold the grid during sampling. A high speed camera was used to image the flame during sampling and the images at various time steps with respect to the initial laser prompt are displayed above. As the evaporated zone advects, the probe begins to enter the flame at approximately 6 ms, and exits at approximately 7.1 ms. Following the exit of the grid from the flame, the flame was extinguished and the sample collected.

Figure 3. Thermophoretic soot sampling was performed using a single action pneumatic piston to insert a TEM grid. High precision tweezers were used to hold the grid during sampling. A high speed camera was used to image the flame during sampling and the images at various time steps with respect to the initial laser prompt are displayed above. As the evaporated zone advects, the probe begins to enter the flame at approximately 6 ms, and exits at approximately 7.1 ms. Following the exit of the grid from the flame, the flame was extinguished and the sample collected.

Figure 4. Signal intensity profiles were obtained using a high speed camera. The profiles are an average of the three center pixels at 9 different times shown in the upper right hand of each image. The y axis shows the signal intensity difference between the flame with an LII pulse and the natural flame luminosity. The intensities were recorded at 10 different laser fluences shown on the right side of the image.
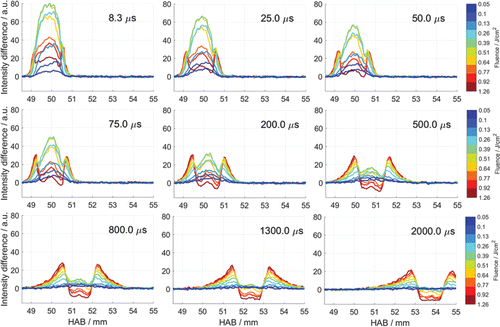
Figure 4. Signal intensity profiles were obtained using a high speed camera. The profiles are an average of the three center pixels at 9 different times shown in the upper right hand of each image. The y axis shows the signal intensity difference between the flame with an LII pulse and the natural flame luminosity. The intensities were recorded at 10 different laser fluences shown on the right side of the image.

Figure 5. Signal intensities from the heated soot were obtained using a high speed camera at 10 different laser fluences (shown on the right side). The relative intensities of the signal were tracked through time at 6 different locations in the flame. The tracked locations in the flame are shown in the upper left hand image. The images on the right show time in the x axis beginning at the laser prompt, and in the y axis the relative signal intensity between LII heated soot and the natural soot luminosity.
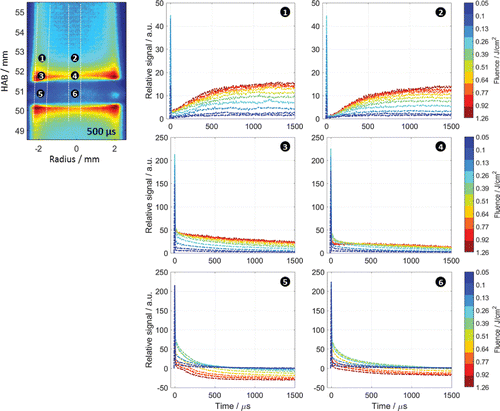
Figure 5. Signal intensities from the heated soot were obtained using a high speed camera at 10 different laser fluences (shown on the right side). The relative intensities of the signal were tracked through time at 6 different locations in the flame. The tracked locations in the flame are shown in the upper left hand image. The images on the right show time in the x axis beginning at the laser prompt, and in the y axis the relative signal intensity between LII heated soot and the natural soot luminosity.

Figure 6. Laser transmittance measured by the light extinction setup. The extinction measurements were taken 7 mm downstream from the LII laser pulse. The laser transmittance was measured using 12 different laser fluences. The time on the x axis starts just prior to the initial LII laser prompt.
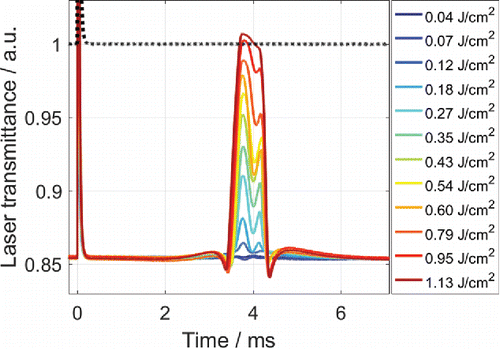
Figure 6. Laser transmittance measured by the light extinction setup. The extinction measurements were taken 7 mm downstream from the LII laser pulse. The laser transmittance was measured using 12 different laser fluences. The time on the x axis starts just prior to the initial LII laser prompt.

Figure 7. Flame temperature measurements were obtained using two different laser fluences (shown in the upper left corner) between approximately 50 and 60 mm HAB. Each image is time stamped at the bottom and a temperature scale is shown on the right side.
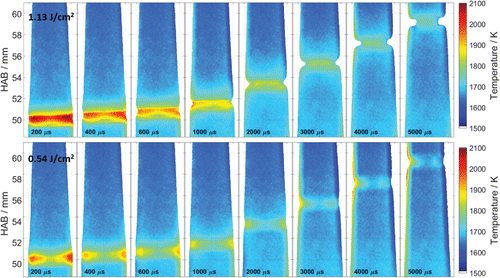
Figure 7. Flame temperature measurements were obtained using two different laser fluences (shown in the upper left corner) between approximately 50 and 60 mm HAB. Each image is time stamped at the bottom and a temperature scale is shown on the right side.

Figure 8. HRTEM micrographs of soot sampled without laser heating (left image) and with laser heating (right image). The red boxed region in the right image has been magnified, converted into a binary image, and then sharpened and is displayed within the image on the right.
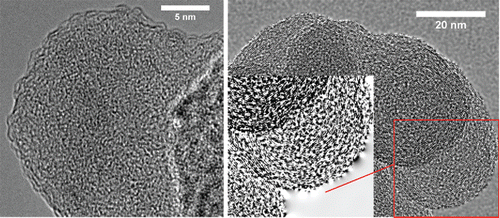
Figure 8. HRTEM micrographs of soot sampled without laser heating (left image) and with laser heating (right image). The red boxed region in the right image has been magnified, converted into a binary image, and then sharpened and is displayed within the image on the right.

Figure 9. Tracking of radially-distributed soot after a high-fluence laser pulse using high speed imaging. The x axis is radial distance and the y axis is time after the LII laser pulse. Particle tracking was performed in the center of the zone directly heated by the LII laser and the absolute signal intensity was mapped. The black dashed line represents the convective boundary streamlines of the flame without laser heating.
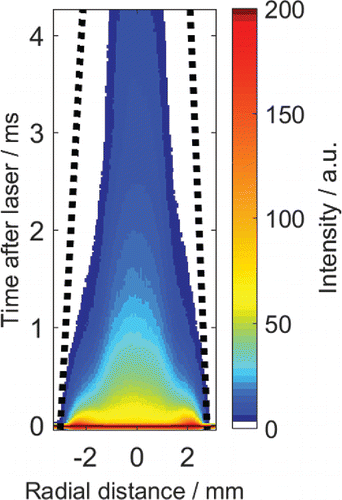
Figure 9. Tracking of radially-distributed soot after a high-fluence laser pulse using high speed imaging. The x axis is radial distance and the y axis is time after the LII laser pulse. Particle tracking was performed in the center of the zone directly heated by the LII laser and the absolute signal intensity was mapped. The black dashed line represents the convective boundary streamlines of the flame without laser heating.
Supplemental material

UAST 1368444 Supplementary File: Visualisation

Download Zip (15.5 MB)

Reprints and Corporate Permissions

Please note: Selecting permissions does not provide access to the full text of the article, please see our help page How do I view content?

To request a reprint or corporate permissions for this article, please click on the relevant link below:

Academic Permissions

Please note: Selecting permissions does not provide access to the full text of the article, please see our help page How do I view content?

Obtain permissions instantly via Rightslink by clicking on the button below:

If you are unable to obtain permissions via Rightslink, please complete and submit this Permissions form. For more information, please visit our Permissions help page.