840
Views
1
CrossRef citations to date
0
Altmetric
Original Articles

Direct measurement of aerosol glass fiber alignment in a DC electric field

, &
Pages 123-135 | Received 10 Mar 2017, Accepted 20 Sep 2017, Published online: 26 Oct 2017

Figures & data

Figure 1. Experimental setup for measurement of fiber alignment (top); Test unit for fiber alignment (bottom).
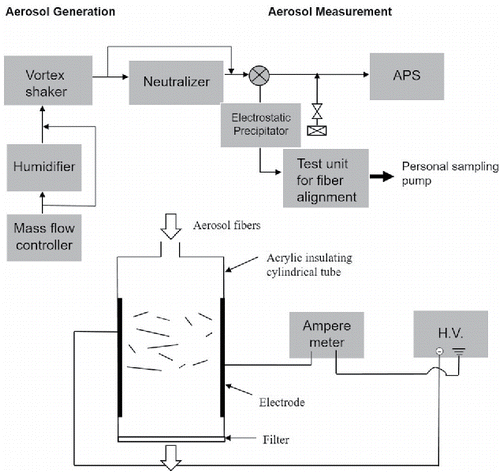
Figure 1. Experimental setup for measurement of fiber alignment (top); Test unit for fiber alignment (bottom).

Figure 2. Configuration of a test section for fiber alignment and schematic diagram of cross sections of two types of electrodes. (a) cylindrical electrodes (b) planar electrodes. The arrows mean starting positions and directions which images of fibers on a filter are scanned toward. Alignment angle (θ) of a fiber was measured relatively to the vertical line, as shown in the top view (b). Perfect alignment of a fiber to the electric field (E) is corresponding to 90 degree.
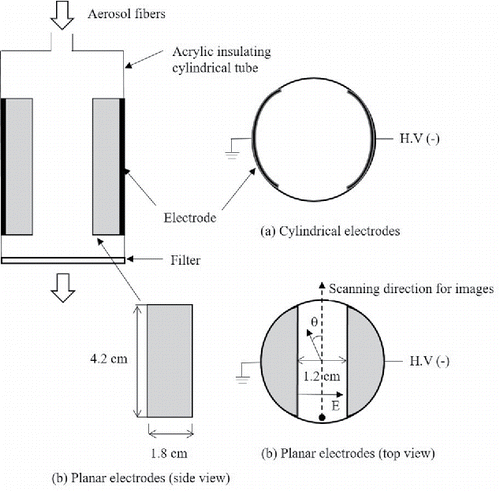
Figure 2. Configuration of a test section for fiber alignment and schematic diagram of cross sections of two types of electrodes. (a) cylindrical electrodes (b) planar electrodes. The arrows mean starting positions and directions which images of fibers on a filter are scanned toward. Alignment angle (θ) of a fiber was measured relatively to the vertical line, as shown in the top view (b). Perfect alignment of a fiber to the electric field (E) is corresponding to 90 degree.

Figure 3. Optical images for fibers collected on MCE filter right after two cylindrical electrodes applied at 8.1 kV of a DC voltage. Naturally charged fibers, dry air and aerosol flow rate 1.5 lpm. Electric field direction is expressed as an arrow on the top left corner of the top image.
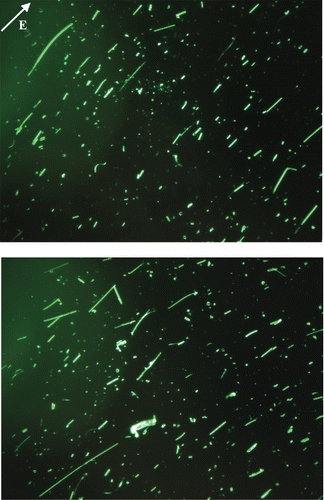
Figure 3. Optical images for fibers collected on MCE filter right after two cylindrical electrodes applied at 8.1 kV of a DC voltage. Naturally charged fibers, dry air and aerosol flow rate 1.5 lpm. Electric field direction is expressed as an arrow on the top left corner of the top image.

Figure 4. Typical optical image for fibers. Dry air and naturally charged, no electric field in parallel plate electrodes.
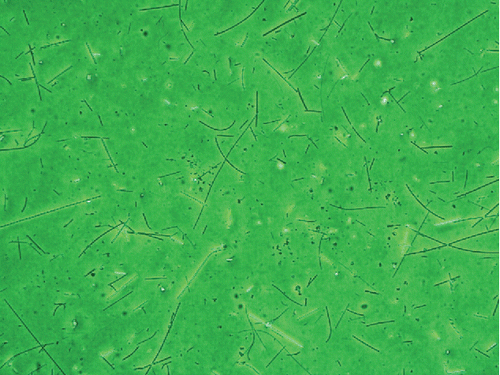
Figure 4. Typical optical image for fibers. Dry air and naturally charged, no electric field in parallel plate electrodes.

Figure 5. Typical optical images for fibers. Dry air and naturally charged, 7.3 kV on parallel plate electrodes. Bright field image (top) and dark field image (bottom) for the same field of view. Electric field direction is expressed as an arrow on the top left corner of the image.
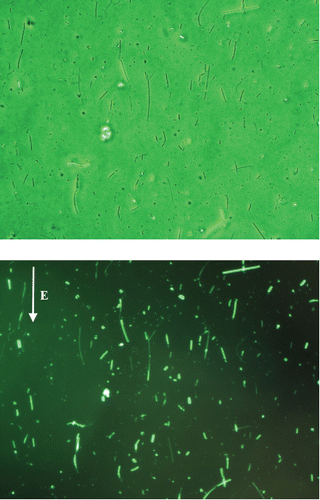
Figure 5. Typical optical images for fibers. Dry air and naturally charged, 7.3 kV on parallel plate electrodes. Bright field image (top) and dark field image (bottom) for the same field of view. Electric field direction is expressed as an arrow on the top left corner of the image.

Figure 6. Angular distributions of fibers in dry condition. (a) No electric field, (b) with electric field for all length fibers, (c) with electric field for lengths smaller than 20 µm, and (d) with electric field for lengths larger than 20 µm. Nt is the total number of fibers counted and N is the number of fibers in each angle bin.
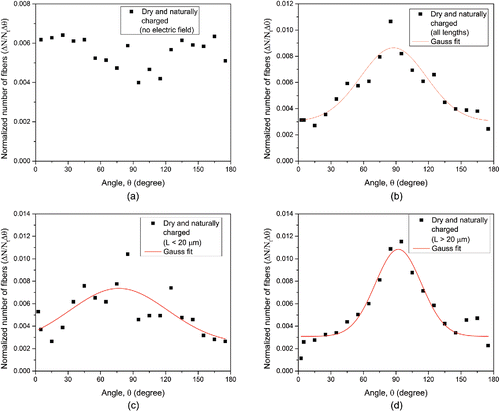
Figure 6. Angular distributions of fibers in dry condition. (a) No electric field, (b) with electric field for all length fibers, (c) with electric field for lengths smaller than 20 µm, and (d) with electric field for lengths larger than 20 µm. Nt is the total number of fibers counted and N is the number of fibers in each angle bin.
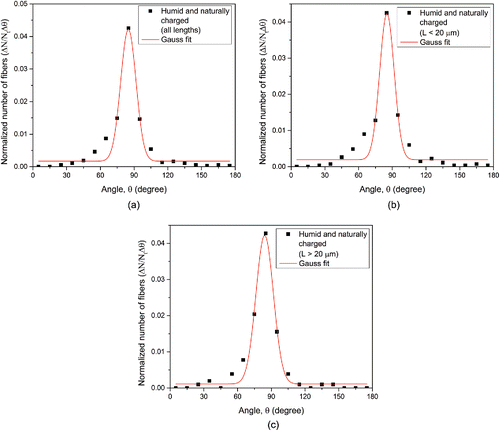
Figure 7. Angular distributions of naturally charged fibers in humid condition. (a) All lengths included, (b) lengths smaller than 20 µm, and (c) lengths larger than 20 µm. Nt is the total number of fibers counted and N is the number of fibers in each angle bin.

Figure 7. Angular distributions of naturally charged fibers in humid condition. (a) All lengths included, (b) lengths smaller than 20 µm, and (c) lengths larger than 20 µm. Nt is the total number of fibers counted and N is the number of fibers in each angle bin.

Table 1. Mean angle, standard deviation, and background particles for angular distributions fitted with Gaussian distributions for different fiber conditions.

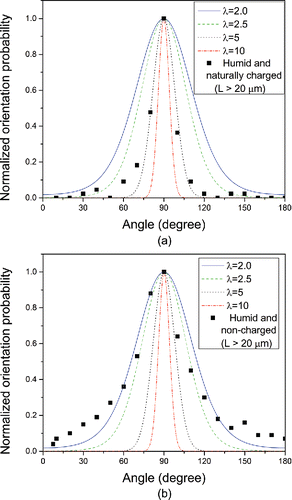
Figure 8. Normalized predicted and measured orientation probability in humid condition. (a) Naturally charged fibers > 20 µm and (b) non-charged fibers > 20 µm. Solid lines are for predicted values and square symbol is for measured one.

Figure 8. Normalized predicted and measured orientation probability in humid condition. (a) Naturally charged fibers > 20 µm and (b) non-charged fibers > 20 µm. Solid lines are for predicted values and square symbol is for measured one.
Supplemental material

UAST_1387640_Supplemental_data

Download PDF (792.5 KB)

Reprints and Corporate Permissions

Please note: Selecting permissions does not provide access to the full text of the article, please see our help page How do I view content?

To request a reprint or corporate permissions for this article, please click on the relevant link below:

Academic Permissions

Please note: Selecting permissions does not provide access to the full text of the article, please see our help page How do I view content?

Obtain permissions instantly via Rightslink by clicking on the button below:

If you are unable to obtain permissions via Rightslink, please complete and submit this Permissions form. For more information, please visit our Permissions help page.