Figures & data
Table 1. Melting temperature TM of the produced metals and metal oxides.
Figure 1. The SDG produces nanoparticles in a carrier gas that are neutralized by a radioactive 63Ni source, and size-selected in two DMAs separated by a tube furnace. Finally, an ESP is used for particle deposition and an electrometer to measure the particle concentration. Hydrogen is supplied either at generation or between the first DMA and the tube furnace.
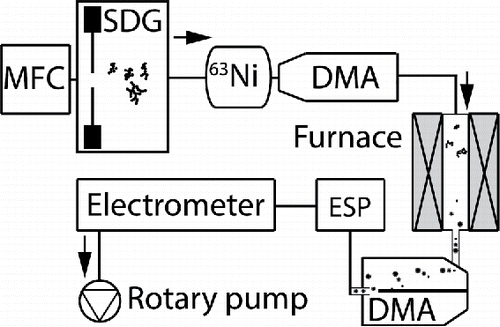
Figure 2. (a) Mobility diameter of 80 nm bismuth nanoparticles after sintering, for particles generated in either a hydrogen mixture or pure nitrogen. TEM images of typical nanoparticles sintered at different temperatures and generated in (b–f) nitrogen or (g–k) a hydrogen mixture.

Figure 3. (a) TEM image of a bismuth nanoparticle generated in a hydrogen mixture and compacted at 400°C, (b) with facets and a non-epitaxial shell. (c) An FFT of the particle in (a) matching the reciprocal structure of bismuth viewed along a zone axis. (d) TEM image of different particles acquired the same day and (e) 9 months later. (f) Nanoparticles generated in nitrogen and compacted at 500°C with, (g) a darker, (h) and brighter phase. (i) FFT of particle in (f) with d-spacings corresponding to Bi2O3 (220) in the bright phase and Bi
) for the dark phase. (j) XRD data of nanoparticles sintered at 500°C generated in the two carrier gases, matching mostly Bi for the hydrogen mixture and Bi + Bi2O3 for the nitrogen gas.
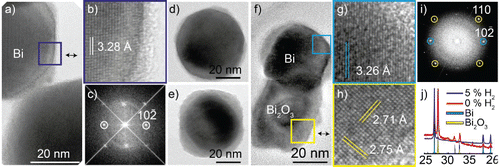
Figure 4. (a) Mobility diameter of 80 nm tin nanoparticles after sintering, for nanoparticles generated in nitrogen or a hydrogen mixture. TEM images of nanoparticles sintered at different temperatures: (b–e) generated in nitrogen; (f–i) generated in a hydrogen mixture.
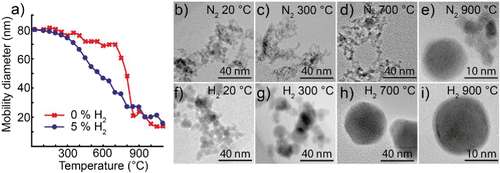
Figure 5. (a) TEM image of a tin nanoparticle generated in a hydrogen mixture and compacted at 900°C, (b) with a single crystalline structure. (c) The FFT of the particle match the reciprocal structure of Sn viewed along a [110] zone axis. (d) XRD of tin nanoparticles generated in a hydrogen mixture and compacted at 900°C. (e) TEM image of spherical nanoparticle generated in nitrogen and compacted at 900°C, with a polycrystalline structure. (f) The FFT of the particle with two different d-spacings that match both Sn+SnO and SnO+SnO2 planes. (g) TEM image of agglomerate generated in nitrogen and compacted at 900°C and (h) FFT with d-spacings matching SnO2 (110).
![Figure 5. (a) TEM image of a tin nanoparticle generated in a hydrogen mixture and compacted at 900°C, (b) with a single crystalline structure. (c) The FFT of the particle match the reciprocal structure of Sn viewed along a [110] zone axis. (d) XRD of tin nanoparticles generated in a hydrogen mixture and compacted at 900°C. (e) TEM image of spherical nanoparticle generated in nitrogen and compacted at 900°C, with a polycrystalline structure. (f) The FFT of the particle with two different d-spacings that match both Sn+SnO and SnO+SnO2 planes. (g) TEM image of agglomerate generated in nitrogen and compacted at 900°C and (h) FFT with d-spacings matching SnO2 (110).](/cms/asset/cb289b29-66c9-4767-9296-10dbac46bc64/uast_a_1411580_f0005_oc.gif)
Figure 6. (a) Mobility diameter of 80 nm cobalt nanoparticles after sintering for nanoparticles generated in a hydrogen mixture and nanoparticles generated in nitrogen. TEM images of nanoparticles sintered at different temperatures and generated in nitrogen (b–e) or a hydrogen mixture (f–i).
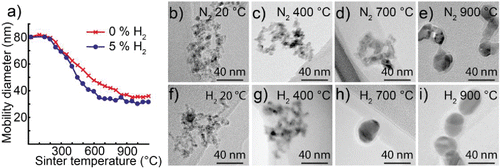
Figure 7. (a) TEM images of cobalt nanoparticle generated in a hydrogen mixture and sintered at 700°C. (b) High-resolution magnification of particle and (c) FFT of compared to face centered cubic Co viewed along a [110] zone axis. (d) TEM images of oxidized Co nanoparticle generated in nitrogen and sintered at 700°C. (e) High-resolution inset with d-spacings matching CoO (in yellow), and either CoO or Co3O4 in white. (f) FFT of the particle from (d). (g) XRD spectra of nanoparticles from (a), (d) with reference spectra for Co and CoO.
![Figure 7. (a) TEM images of cobalt nanoparticle generated in a hydrogen mixture and sintered at 700°C. (b) High-resolution magnification of particle and (c) FFT of compared to face centered cubic Co viewed along a [110] zone axis. (d) TEM images of oxidized Co nanoparticle generated in nitrogen and sintered at 700°C. (e) High-resolution inset with d-spacings matching CoO (in yellow), and either CoO or Co3O4 in white. (f) FFT of the particle from (d). (g) XRD spectra of nanoparticles from (a), (d) with reference spectra for Co and CoO.](/cms/asset/ae4b3174-eb87-44d6-900a-7a9d7c2363d7/uast_a_1411580_f0007_oc.gif)
Figure 8. (a) Mobility diameter of 80 nm gold nanoparticles after sintering at different temperatures for the two carrier gases. Nanoparticles generated in nitrogen and sintered at (b) room temperature or (c) 500°C. (d) A magnification of the crystal structure with (e) the FFT matching Au viewed along [110]. Gold nanoparticles generated in hydrogen mixture and sintered at (f) room temperature or (g) 500°C. (h) Magnification of particle with (i) the FFT matching Au viewed along [100].
![Figure 8. (a) Mobility diameter of 80 nm gold nanoparticles after sintering at different temperatures for the two carrier gases. Nanoparticles generated in nitrogen and sintered at (b) room temperature or (c) 500°C. (d) A magnification of the crystal structure with (e) the FFT matching Au viewed along [110]. Gold nanoparticles generated in hydrogen mixture and sintered at (f) room temperature or (g) 500°C. (h) Magnification of particle with (i) the FFT matching Au viewed along [100].](/cms/asset/309b037e-aeeb-486b-89a7-0180c3764b53/uast_a_1411580_f0008_oc.gif)
Table 2. Composition and identified phases of compacted nanoparticles generated in a hydrogen mixture or in nitrogen.
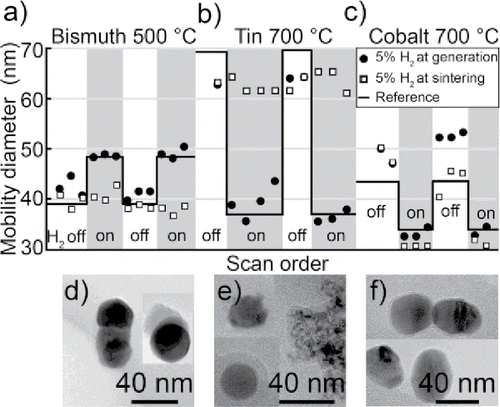
Figure 9. The mode of nanoparticles after sintering for two series of gas modifications, for (a) bismuth, (b) tin, and (c) cobalt. Hydrogen is introduced either at generation or at sintering. The reference refers to the expected mobility diameter. TEM images of typical nanoparticles generated in nitrogen but sintered in a hydrogen mixture for (d) bismuth, (e) tin and (f) cobalt.
