Figures & data
Table 1. Subject demographics and airway characteristics.
Table 2. Breath defining parameters.
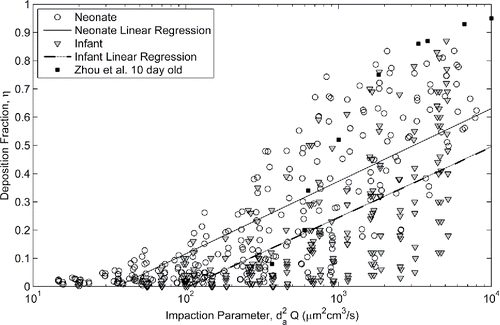
Figure 2. Comparison of deposition in population of neonate models (this study) to deposition in the population of infant nasal airways (Storey-Bishoff et al. Citation2008) and to deposition in a 10 day old infant (Zhou et al. Citation2014).

Figure 5. Deposition measured in neonatal nasal airways compared to the correlation developed by Storey-Bishoff et al. (Citation2008) for deposition measured in infants (r2 = 0.47).

Table 3. Summary of r2 values for each characteristic diameter. Values of α, β, γ are different in each case found using non-linear least squares fitting.
Figure 6. Deposition in neonatal nasal airways vs. non-dimensional deposition parameter, characteristic diameter defined D = V/AS, fit defined in EquationEquation (9)[9] , r2 = 0.97.
![Figure 6. Deposition in neonatal nasal airways vs. non-dimensional deposition parameter, characteristic diameter defined D = V/AS, fit defined in EquationEquation (9)[9] , r2 = 0.97.](/cms/asset/c1a7e1a1-997b-4c2c-b222-a1c8f678bf52/uast_a_1413489_f0006_b.gif)
Figure 7. Neonatal nasal deposition as a function of Stokes number, characteristic diameter defined D = V/AS, fit defined in EquationEquation (10)[10] , r2 = 0.69.
![Figure 7. Neonatal nasal deposition as a function of Stokes number, characteristic diameter defined D = V/AS, fit defined in EquationEquation (10)[10] , r2 = 0.69.](/cms/asset/8722061c-49a6-4b96-9ca8-c4c282d1a8df/uast_a_1413489_f0007_b.gif)
Table 4. Total deposition (on a mass basis) of aerosol with MMAD of 3.7 µm and GSD of 2.
Figure 8. Predicted deposition (using EquationEquation (10)[10] ) versus in-vitro measured deposition. Solid line indicates line of identity; dashed lines bound 95% of the data.
![Figure 8. Predicted deposition (using EquationEquation (10)[10] ) versus in-vitro measured deposition. Solid line indicates line of identity; dashed lines bound 95% of the data.](/cms/asset/34ccf553-5f6e-47a9-b89a-ac8183ee576d/uast_a_1413489_f0008_b.gif)
Table 5. Comparison of average and variability in total deposition in adults (Ruzycki et al. Citation2017) and neonatal infants (in vitro) when normally inhaling an aerosol with MMAD 3.7 µm and GSD of 2.


