Figures & data
Figure 1. Each FT-IR test spectrum's squared Mahalanobis distance () plotted against absolute error (
; a) and cross plot comparing FT-IR predictions to TOR EC (b). Elizabeth, NJ samples are distinguished from the other eight sites as triangles (red) in both plots. Boundaries and complementary 95% confidence intervals were calculated as three times the mean-squared Mahalanobis distance and 3.5 times mean absolute error of the calibration samples, denoted as an encircled X (a). Dashed lines (b) qualify the systematic deviation in Elizabeth, NJ samples from the other eight sites via robust least-square regression.
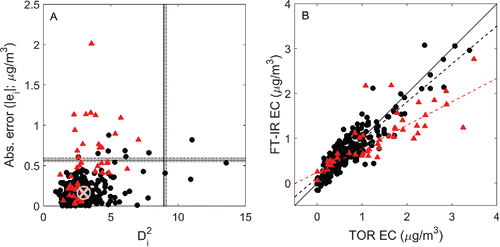
Figure 2. Example of classifying an unknown spectrum () as either atypical or typical using PLS-DA (a). In this context, the PLS scores (
and
) may be thought of as transformed FT-IR spectra where each point represents a spectrum, distinguished here according to class label. For the purpose of this illustration, 200 atypical and typical samples were simulated from two Gaussian distributions with a mean of (−2, −2) and (6,6), respectively. Simulated class variances are equal (
,
). Estimating the mean of each class and pooled-covariance matrix defines the boundary used to classify and then allocate an unknown test spectrum (star; a) to the appropriate FT-IR calibration (dashed path; b).
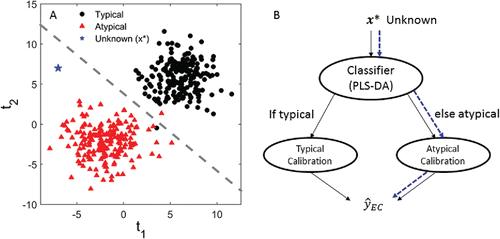
Table 1 . FT-IR EC determined using either the single or multilevel model. MDLs were determined separately for the typical and atypical calibrations with the later not estimable given only one test set blank classified as atypical.
Figure 3. TOR EC plotted against FT-IR EC for typical (a) and atypical (b) model predictions. Typical samples and atypical samples are distinguished as bullets (black) and triangles (red), respectively. Seven atypical Elizabeth, NJ samples were misclassified as typical explaining their affiliation with the typical model (a). No typical samples were misclassified as atypical (b). Dashed lines are calculated using robust least squares and qualify any systematic deviations present in either model's predictions.
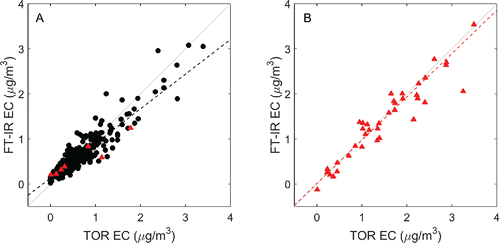
Figure 4. Typical CSN spectra (light gray). A representative typical CSN spectrum (solid line; blue), PTFE blank (dashes; red), and wavenumbers used for calibration (vertical bars) are designated. Note, negative absorption is an artifact of baseline correction. Thicker vertical bars indicate that several adjacent wavenumbers were chosen for calibration.
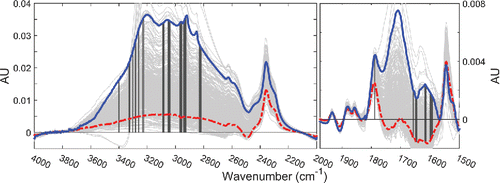
Figure 5. Atypical CSN spectra (light gray). A representative “typical” spectrum (solid line; blue), PTFE blank (dashes; red), and wavenumber used for calibration (vertical bars) are labeled. Thicker vertical bars indicate that several adjacent wavenumbers were chosen for calibration.
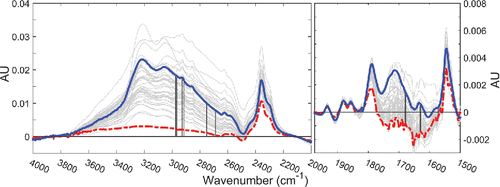
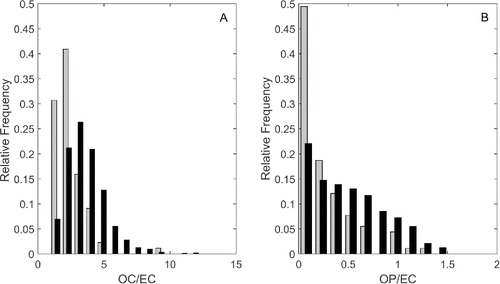
Figure 6. Distribution of OC/EC and OP/EC in Elizabeth, NJ samples (gray) and the other CSN sites (black).