Figures & data
Figure 1. Overview of the experimental setup including the soot preparation system and the measurement devices. The multiwavelength extinction system and the soot extinction cell is shown in the dashed area.
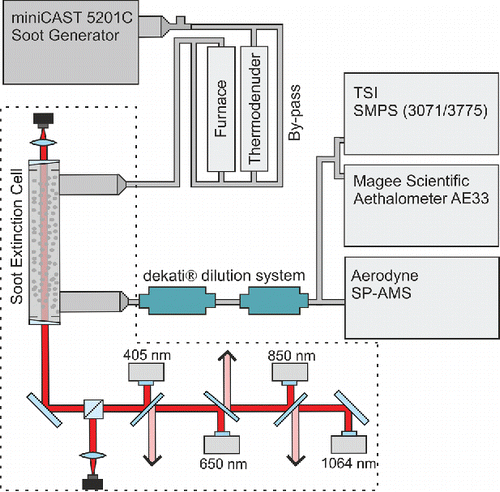
Table 1. The operating point settings used during the experiments. The fuel (propane) and quench-gas (nitrogen gas) flows were held constant throughout all experiments, while no internal air-dilution was used to minimize the oxygen concentration in the carrier gas and thereby oxidation effects on the soot.
Figure 2. The absorption Ångström exponent (AAE) from the mini-CAST operating points with and without heat-treatment from (a) the in-situ multiwavelength extinction measurements using four wavelengths and from (b) the aethalometer filter measurements, using seven wavelengths.
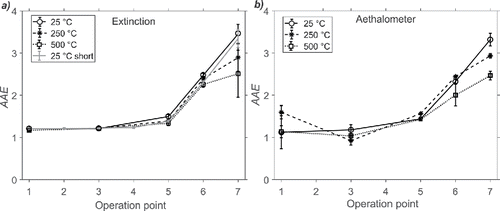
Figure 3. (a) eBC-to-EC ratios showing values close to 1 for all operating points (OP) and temperatures. (b) eBC-to-TC ratios decreasing with OP. (c) OC-to-TC and OC+PC-to-TC ratios increasing with OP and decreasing after heat-treating. (d) PAH-to-TC ratios. The error bars show ±1 STD.
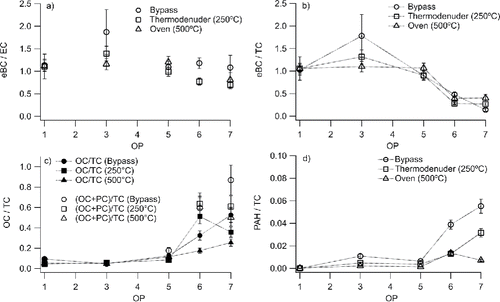
Figure 4. rBC carbon ion cluster distribution in laser vaporizer SP-AMS mass spectra of: (a) OP1 soot and (b) OP7 soot.
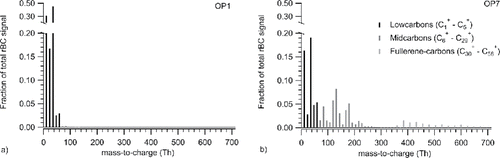
Figure 5. The ratio between MAC(520 nm) for EC and ∑OC+PC as a function of the AAE for the EC is shown. As EC commonly is assumed to have AAE ∼ 1, this value is marked as a dashed vertical line. Also the lower limit for a realistic MAC ratio between EC and ∑OC+PC is marked with the horizontal dashed line. In the bottom part of the figure, the measured AAE from both extinction and aethalometer measurements are presented for comparison.
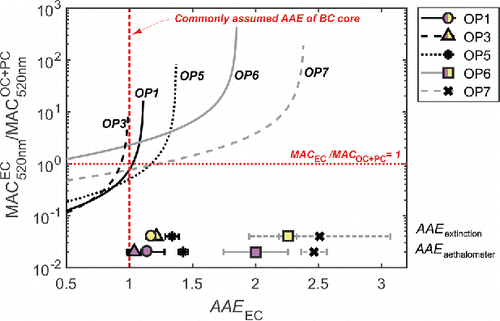
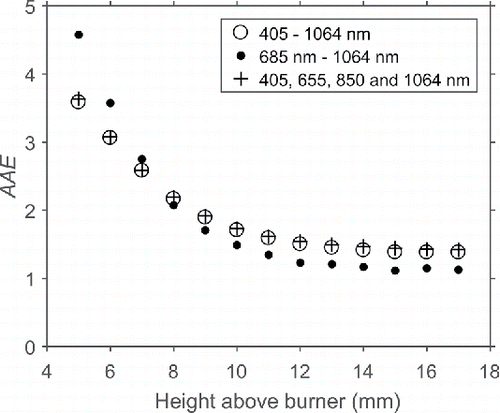
Figure 6. AAE for soot in an Φ = 2.3 premixed McKenna flame as function of height above burner (5–17 mm). The hollow circles show the AAE evaluated using the extinction at 12 wavelengths between 405 and 1,064 nm, the black dots using the wavelengths above 685 nm and the crosses using the same wavelengths used as in our mini-CAST experiments.