
Figures & data
Figure 1. Measurement setups. The particle generation setup (a) remained the same during all measurements. The instrument setups (b–e) were varied depending on the measurement interest. Setup (b) was used to characterize the particle growth unit, (c) the DMA transfer function, (d) the flow splitter bias, and (e) was used in the CPC calibration.
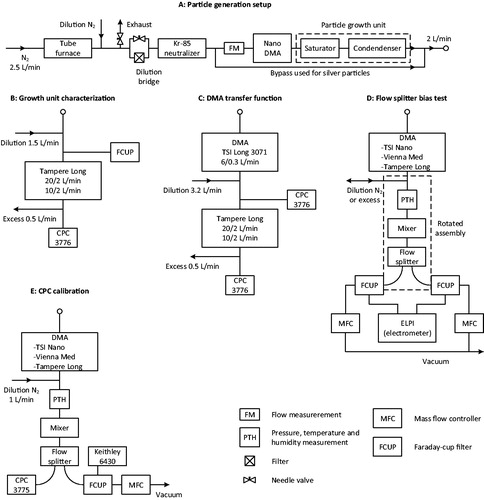
Figure 2. Growth unit size distributions for different saturator temperatures (°C) (a) and mode diameters as a function of temperature (b). The symbol Dp refers to the particle mobility diameter.
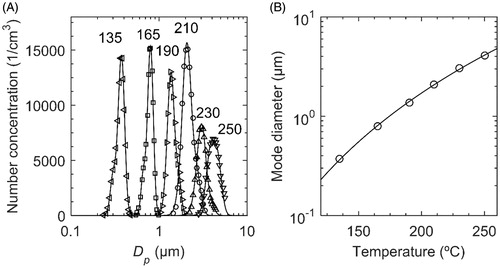
Figure 3. Tampere Long DMA transfer function for 20 L/min and 10 L/min sheath flows and 2 L/min sample flow rates.
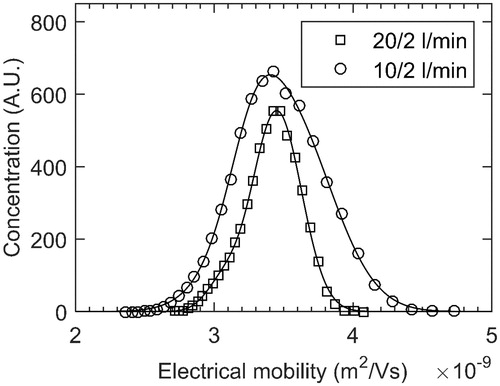
Figure 4. Flow splitter bias as a function of particle mobility diameter Dp at 1.5 L/min flow rate (a) and as a function of FCAE flow rate at 5.3 µm particle diameter (b) together with the expanded measurement uncertainties (coverage factor k = 2).
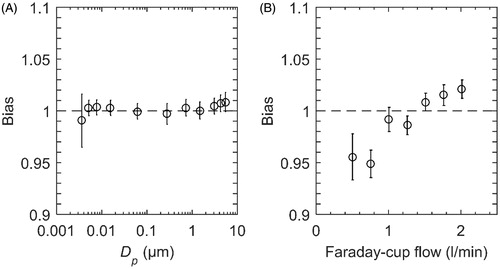
Figure 5. CPC 3775 detection efficiency ηCPC as a function of particle mobility diameter Dp including expanded uncertainties (k = 2). The measurement point particle material and the DMA type is given in the legend.
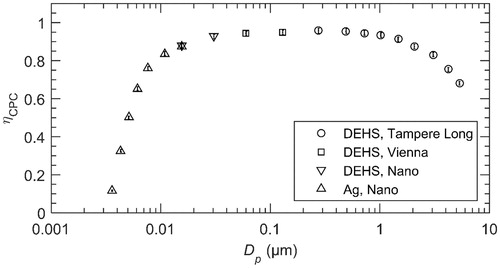
Table 1. Components of the expanded (k = 2) calibration uncertainties (%) for three different particle diameters.