Figures & data
Figure 1. The sum of positive and negative charge fractions estimated from modeling and from experiments, where q is the number of elementary charges carried by particles. For predictions using Fuchs’ model, 143 ion combinations were used. The box boundaries indicate the 25th and 75th percentiles, respectively; the line within the box marks the median; whiskers (error bars) above and below the box indicate the 90th and 10th percentiles, respectively; circles are 5th and 95th outlying points.
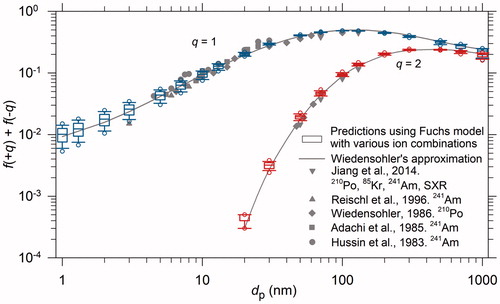
Figure 2. Weighted deviation between the input PNSD and inverted PNSD using various inversions. The subscripts “W” and “C” indicate that charge fractions were estimated using Wiedensohler’s approximation (a) and Chen and Jiang’s method, respectively (b). The superscripts “+” and “-” indicate that the inversion was based on positively and negatively charged particles, respectively. The subscripts “average” and “sum” correspond to average inversion and sum inversion, respectively. Z+ion and Z-ion are the mobilities of positive and negative ions, respectively. The dashed line corresponds to an ion mobility ratio of 0.875.
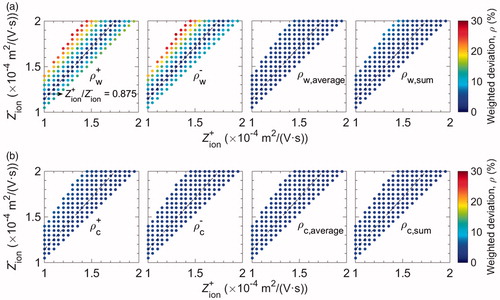
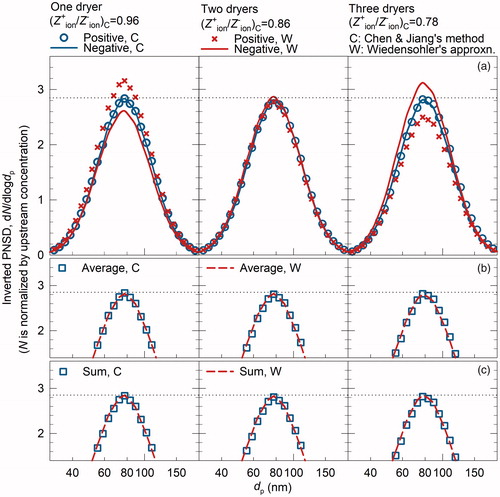
Figure 3. Inverted PNSDs using conventional inversion (a), average inversion (b), and sum inversion (c). “W” and “C” indicate that charge fractions were estimated using Wiedensohler’s approximation and Chen and Jiang’s method, respectively. The included ion mobility ratio was estimated using Chen and Jiang’s method. The horizontal dotted line corresponds to the same value (2.85) to guide the comparison among all the inverted PNSDs.