Figures & data
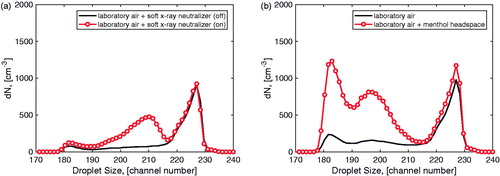
Figure 1. Particle size-dependent detection efficiencies for negative and positive, singly charged AS aerosol, determined as the ratio of the DEG UF-CPC concentration to the electrometer concentration. The relative uncertainty for each measured of detection efficiency is less than 10%.
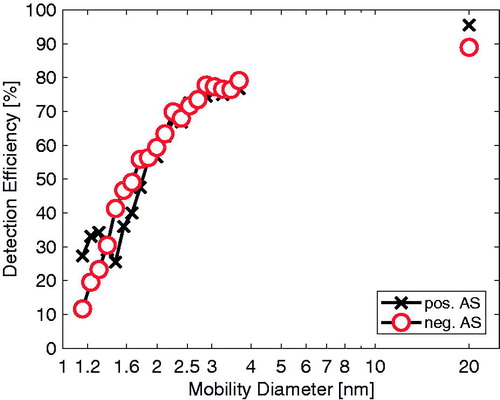
Figure 2. (a) Measured DEG droplet size distributions as a function of droplet size (channel number) for sampled negative charged AS aerosol of size 1.5, 3.0, and 20 nm. (b) Comparison of measured droplet size distributions (from sampled negative charged AS aerosol of size 1.5, 3.0, and 20 nm) with modeled kernel functions defined by EquationEquations (2)(2) and Equation(3)
(3) , and values in .
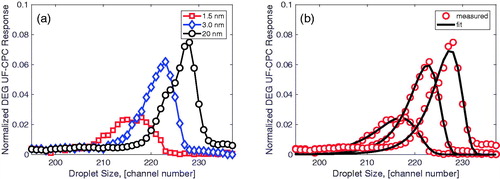
Figure 3. Comparison of best-fit parameter values (open circle) for the analytical kernel function defined in EquationEquation (2)(2) as a function of size for negative, singly charged AS aerosol, with resulting fit (solid line) of EquationEquation (3)
(3) using values in .
Table 1. Best-fit values of ,
,
, and
to obtain the explicit size-dependence of the parameters
,
, and
according to EquationEquation (3)
(3) .
Figure 4. (a) Assumed, idealized multi-modal aerosol size distribution, with a nucleation mode (geometric mean diameter = 1.6 nm, number concentration = 1000 cm−3) and Aitken mode (geometric mean diameter = 100 nm, number concentration = 1000 cm−3), used for numerical testing of inversion algorithm. (b) Droplet size distribution calculated from assumed, idealized distribution in (a), with up to ±10% noise added to the droplet size distribution at each channel. (c) Comparison of assumed ambient distribution (from a) with size distribution obtained from inversion of droplet size distribution (from b).
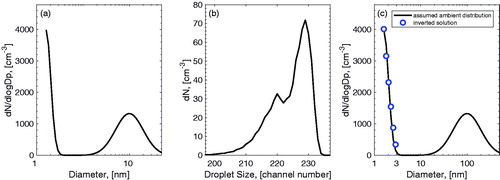
Figure 5. (a) Droplet size distribution acquired when sampling laboratory air, and when sampling laboratory air mixed with sub-3 nm ions generated by a soft X-ray neutralizer. (b) Droplet size distribution acquired when sampling laboratory air, and when sampling laboratory air mixed with vapor sampled from the headspace above solid menthol at room temperature.