
Figures & data
Figure 1. Schematic of the flow tube reactor.
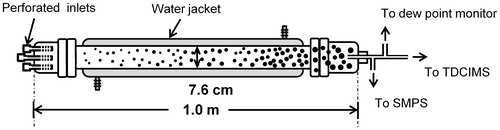
Figure 2. Size distributions of particles measured by SMPS from the reactions of (a) 2.5 × 1010 cm−3 H2SO4 with 8.9 × 1010 cm−3 DMA, and (b) 2.5 × 1010 cm−3 H2SO4 with 1.3 × 1012 cm−3 NH3 under dry conditions and at 60% RH.
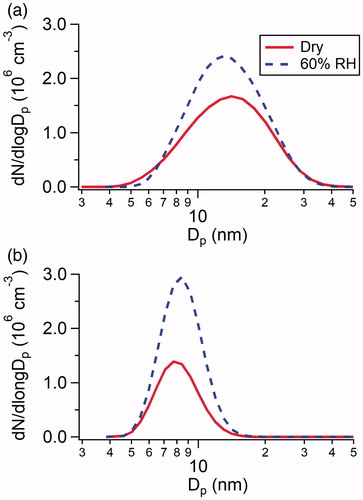
Figure 3. Typical desorption profiles of ions formed by heating H2SO4-DMA (a, c) and H2SO4-NH3 (b, d) particles collected on the Pt filament. The top panels show ions collected in the negative ion mode. The lower panels show ions collected in the positive ion mode. The dashed lines show the evolution of the filament temperature.
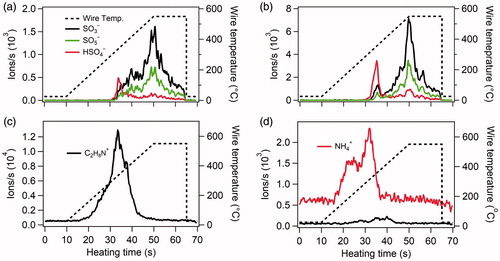
Figure 4. Size resolved acid:base ratio of newly formed particles in the H2SO4-DMA system under dry conditions and at 60% RH. The concentrations of H2SO4 and DMA introduced into the flow tube reactor were 2.5 × 10¹⁰ and 8.9 × 1010 cm−3, respectively, for both the dry conditions and at 60% RH. The error bars represent standard deviations of at least three repeated measurements. The horizontal black line represents the acid:base ratio of fully neutralized H2SO4-DMA particles.
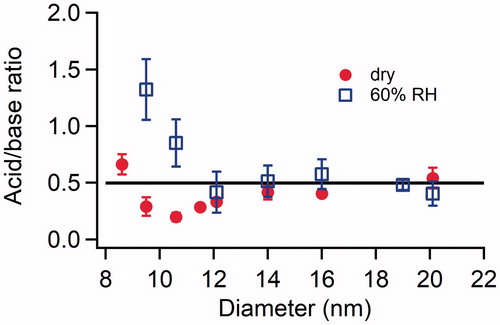
Figure 5. Ratios of SO5−:SO3− and HSO4−:SO3− as a function of particle size for newly formed particles in the H2SO4-DMA system under dry conditions. The concentrations of H2SO4 and DMA introduced into the flow tube reactor were 2.5 × 10¹⁰ and 8.9 × 1010 cm−3, respectively. The error bars represent standard deviations of at least three repeated measurements. The horizontal black line represents a SO5−:SO3− ratio of 0.44.
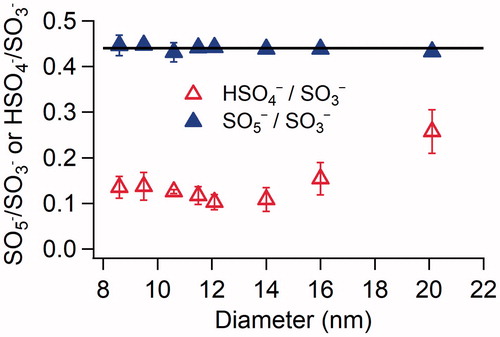
Figure 6. Size resolved acid:base ratio of newly formed particles formed in the H2SO4-NH3 system under dry conditions and at 60% RH. The concentrations of H2SO4 and NH3 introduced into the flow tube reactor were 2.5 × 10¹⁰ and 1.3 × 1012 cm−3, respectively, for both the dry conditions and 60% RH. The error bars represent standard deviations of at least three repeated measurements. The horizontal black line represents the acid:base ratio of fully neutralized H2SO4-DMA particles.
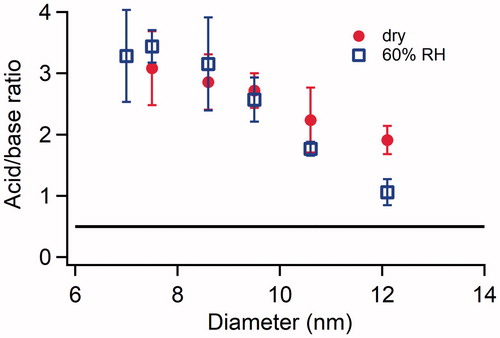
Table 1. Thermodynamic modeling of H2SO4-NH3 and H2SO4-DMA particles.