Figures & data
Figure 1. Experimental results. (a) Structure factor S(q) of the carbon gel particles produced from our BoF aerosol reactor. S(q) scales with a power law exponent of − (2Dm−Ds) with values of −3.0 ± 0.2 and −1.8 ± 0.2 indicating the hybrid morphology at different length scales. The white bars in the inset of electron microscopy images of the carbon gels represent 10 µm length scale. (b) The number of monomers N vs. radius of gyration normalized by monomer radius, Rg/a of these gels is shown by diamonds (experimental work) (Liu et al. Citation2017) and circles (simulations using our diffusion limited cluster-cluster aggregation (DLCA) model). Both indicate a Dm = 2.5 ± 0.1. From (a) and (b), a Ds ≈ 2 (smooth and solid surface) is implied for these particles.
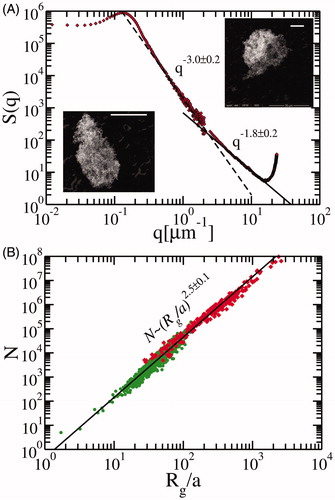
Figure 2. Monomer pair correlation function g(r) for gel particles and their projected surfaces. Pair correlation vs. intermonomer distance r normalized by monomer diameter d scales as rD-3, where D = Dm or Ds depending on the type of analysis (volume or surface). (a) For the less dense gel particles corresponding to fv = 0.003 (Monomer-Dilute Gel), both volume g(r) and surface g(r) follow a Dm = Ds = 1.8 trend (solid line) until crossing over to the super-micron size regime where Dm = Ds = 2.5 ± 0.2. (b) The “Monomer-Dense Gel” corresponding to fv = 0.1 follows the Dm = Ds = 1.8 trend at small length scales ∼ r/d = 4. At scales larger than this, surface g(r) follows a Ds = 2.0 ± 0.1 while g(r) maintains a Dm ≈ 2.5. Both experience an exponential cutoff at large r/d due to the finite size of the particles.
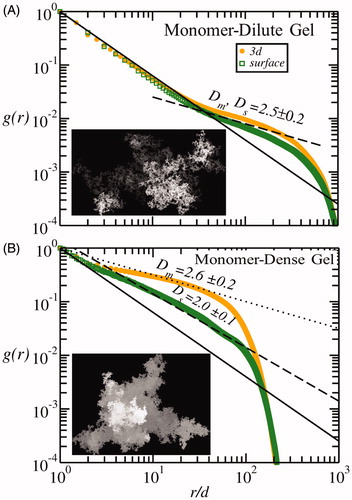
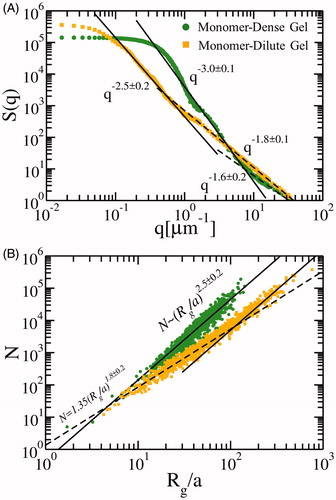
Figure 3. Discrepancy in scaling of S(q) and Dm. (a) Forward normalized S(q) of monomer-dense (circles) and monomer-dilute gel (squares). For monomer-dilute gel, S(q) scales with a power-law of −2.5 ± 0.2 at small q and crosses over to a −1.8 ± 0.1 scaling. This scaling dependence is consistent with previous findings. For monomer-dense gel, S(q) scales with −3.0 ± 0.1 in the small q region and then crosses over to a −1.6 ± 0.2. (b) The corresponding N vs. Rg/a plots for both aggregate types scale with a constant Dm=2.5 ± 0.2 via Equation (1). For monomer-dense gel with Dm=2.5, their S(q) slope of −3 can only be explained provided Ds=2.0.