Figures & data
Figure 1. (a) The ratio of positive to negative charge fractions with the same number of elementary charges, fF(+q, dp)/fF(-q, dp), as a function of the mobility ratio of positive and negative ions, , for particles with the diameter of 30 nm and 100 nm, respectively. Positive ion mobility,
, and negative ion mobility,
, with values ranging from 1.00 to 2.00
10-4 m2/V·s and an interval of 0.05
10-4 m2/V·s were tested, i.e., 441 combinations of
and
. Experimental data from Hussin et al. (Citation1983), Adachi et al. (Citation1985), and Wiedensohler et al. (Citation1986) are also plotted. (b) The fitted proportionality constant, k, for ln[fF(+q, dp)/(-q, dp)] and ln(Z+ion/Z-ion) as a function of particle diameter and the elementary charges carried by the particles. When dp is greater than 20 nm, k is approximately equal to 2q and is nearly independent of the particle size. For small particles, the fractions with 2 or more charges are negligible such that their data are not included. The fitted ion mass-mobility relations by Mäkelä et al. (Citation1996) and Steiner et al. (Citation2014) were both used for the estimation.
![Figure 1. (a) The ratio of positive to negative charge fractions with the same number of elementary charges, fF(+q, dp)/fF(-q, dp), as a function of the mobility ratio of positive and negative ions, , for particles with the diameter of 30 nm and 100 nm, respectively. Positive ion mobility, , and negative ion mobility, , with values ranging from 1.00 to 2.0010-4 m2/V·s and an interval of 0.0510-4 m2/V·s were tested, i.e., 441 combinations of and . Experimental data from Hussin et al. (Citation1983), Adachi et al. (Citation1985), and Wiedensohler et al. (Citation1986) are also plotted. (b) The fitted proportionality constant, k, for ln[fF(+q, dp)/(-q, dp)] and ln(Z+ion/Z-ion) as a function of particle diameter and the elementary charges carried by the particles. When dp is greater than 20 nm, k is approximately equal to 2q and is nearly independent of the particle size. For small particles, the fractions with 2 or more charges are negligible such that their data are not included. The fitted ion mass-mobility relations by Mäkelä et al. (Citation1996) and Steiner et al. (Citation2014) were both used for the estimation.](/cms/asset/b4c56de4-ccb8-423e-a0ec-fc3da432552e/uast_a_1498587_f0001_c.jpg)
Figure 2. (a) Example of the raw PNSDs; (b) the procedure of estimating the ion mobility ratio from the raw PNSDs. The diameter and raw particle concentrations of ith (g(i)th) size bin are dp,i (dp,g(i)) and (
), respectively. The counting variable i starts from the peak size bin. Function g(i) maps dp,i to dp,g(i), particles in which diameter are doubly charged and have the same electrical mobility as particles in the diameter of dp,i. Continue searching for the size bin until it meets the requirements that
and that dp,g(i) is within the limit of measurement. Then
can be estimated from
.
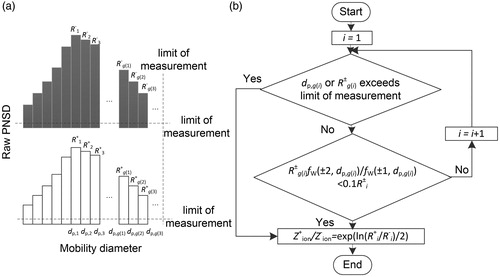
Figure 3. The estimated ion mobility ratio, ()P, using the proposed method is compared to the input ion mobility ratio,
, that is presented as dots in the figure. The dash-lines are to guide the comparison. Geometric mean diameters (dpg) of the lognormally distributed testing aerosols are 20, 30, 50, 70, 100, 130, 200, and 300 nm, respectively. Geometric standard deviations (σg) are 1.1, 1.2, 1.3, 1.5, 1.8, 2.1, and 2.5, respectively. In total, 56 combinations of dpg and σg were tested.
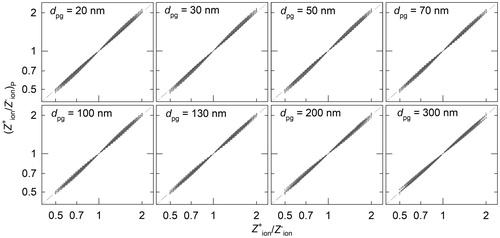
Figure 4. (a) Box plots of relative differences between charge fractions calculated using Gunn & Woessner’s formula, fG(q, dp), and using Fuchs’ theory, f F(q, dp), i.e., [fG(q, dp) - f F(q, dp)]/f F(q, dp). (b) Correction coefficient, α, as a function of dp. The included formulae were obtained by fitting the 441 median α values. For all the plots: the boundaries of the box indicate the 25th and 75th percentiles, respectively; the line within the box marks the median; whiskers (error bars) above and below the box indicate the 90th and 10th percentiles, respectively; circles are 5th and 95th outlying points.
![Figure 4. (a) Box plots of relative differences between charge fractions calculated using Gunn & Woessner’s formula, fG(q, dp), and using Fuchs’ theory, f F(q, dp), i.e., [fG(q, dp) - f F(q, dp)]/f F(q, dp). (b) Correction coefficient, α, as a function of dp. The included formulae were obtained by fitting the 441 median α values. For all the plots: the boundaries of the box indicate the 25th and 75th percentiles, respectively; the line within the box marks the median; whiskers (error bars) above and below the box indicate the 90th and 10th percentiles, respectively; circles are 5th and 95th outlying points.](/cms/asset/fda71b96-da64-4205-9429-170f5012e12d/uast_a_1498587_f0004_b.jpg)
Figure 5. Weighted deviation between the input PNSD and the inverted PNSDs using the proposed method () and using Wiedensohler's approximation (
) for aerosol charge fractions. The superscript indicates that the inverted PNSD is from positively or negatively charged particles. dpg and σg of the testing aerosol are 100 nm and 1.5, respectively.
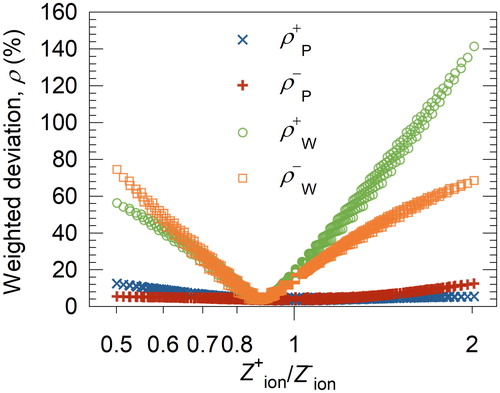
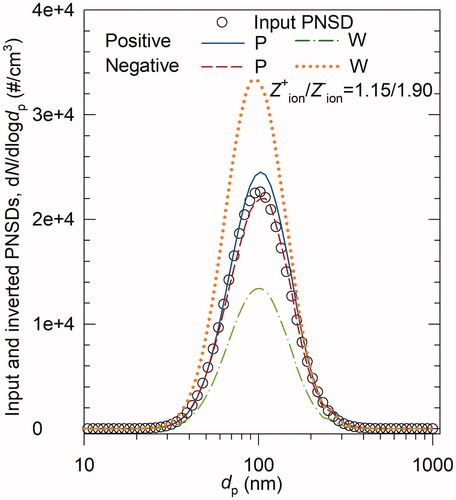
Figure 6. Comparison of the inverted PNSDs using the proposed method (P) and using Wiedensohler’s approximation (W) for aerosol charge fractions. is 1.15/1.90. The geometric mean diameter and geometric standard deviation of the testing aerosols are 100 nm and 1.5, respectively. The solid (blue line and dashed (red) line are the inverted PNSDs from the raw PNSDs of positively and negatively charged particles, respectively, using the proposed method. The dash-dot (green) line and dots (orange) are those using Wiedensohler’s approximation.