
Figures & data
Figure 1. Map showing flight tracks (grey) during the SEAC4RS campaign. The plumes where aerosol absorption is greater than 20 Mm−1 are highlighted where the color-scale indicates the level of CO in the plume. The Rim Fire (black dashed) and agricultural (Ag, white dashed) fires are highlighted separately.
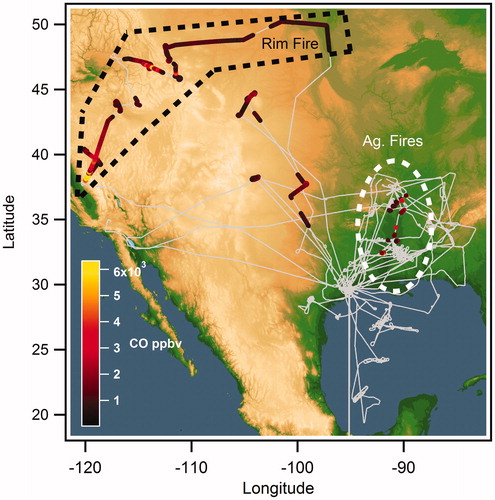
Figure 2. Time series of absorption and black carbon concentration as a function of time during the 26 August 2013 for (a) the unadjusted data and (b) the data after wavelength adjustment and 10 s averaging. The scatter in the 1 s data in panel A is due to both instrumental noise/precision and particle shot noise; however, in panel b, the uncertainties are dominated by overall accuracy of each measurement.
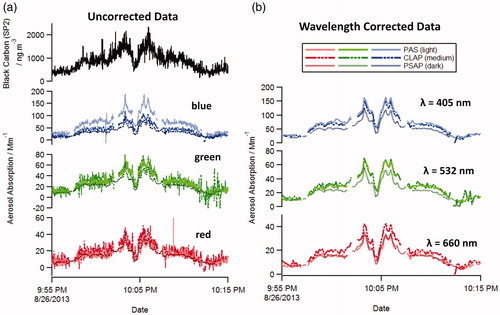
Figure 3. Scatter plots comparing the green (532 nm, left plots) and red (660 nm, right plots) absorption data. Orthogonal distance fits (gray) and 1:1 lines (black) are shown.
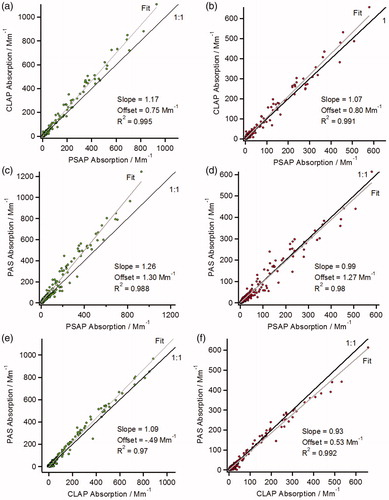
Figure 4. Scatter plots comparing the 405 nm absorption data during plumes. Plots (a), (b), and (c) show comparisons of the absorption coefficients by instrument, and plot (d) shows the PAS 405 nm data against the PAS 532 nm data. Each insert plot shows the same data where the scale is limited to less than 200 Mm−1. Orthogonal distance fits (gray) and 1:1 lines (black) are shown.
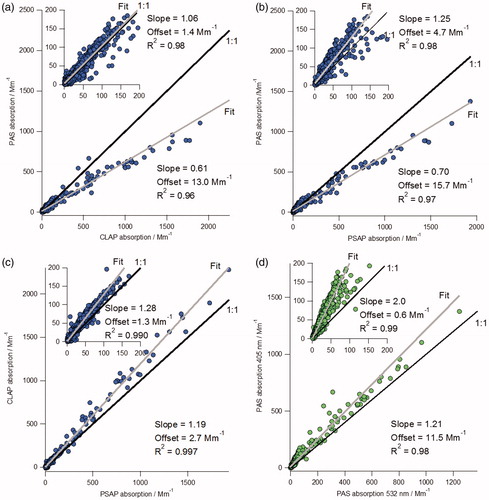
Figure 5. Histograms of single scattering albedo and effective mass absorption coefficient for plume data taken during SEAC4Rs. Blue PAS data greater than 200 Mm−1 are excluded from these plots. In each case the single scattering albedo is calculated as the ratio of the difference between the CRDS extinction and the absorption to the CRDS extinction. TD indicates data from the thermodenuded PAS cells.
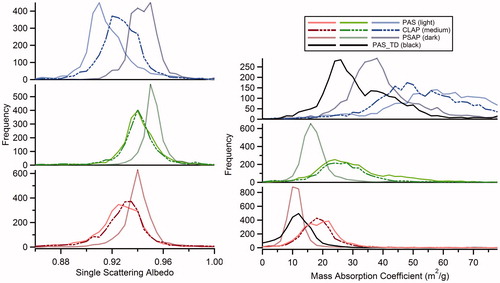
Table 1. Single scattering albedo and mass absorption cross-section averages for all SEAC4RS plumes.
Table 2. Absorption Ångström exponents for aerosol absorption in plumes.