Figures & data
Figure 1. (a) Schematic diagram of the coaxial nebulizer. 1 – outside capillary, 2 – internal capillary. (b) Schematic diagram of the sample desorption from the surface with the coaxial nebulizer. 1 – examined surface, 2 – spot of deposited RDX.
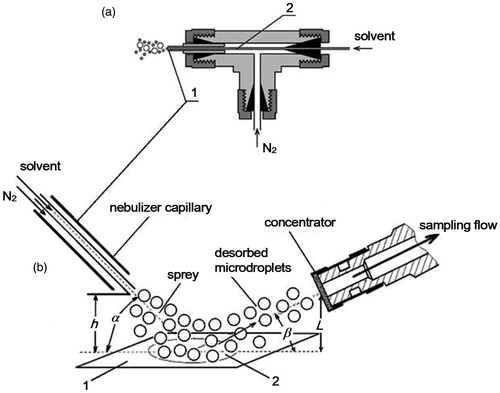
Figure 2. Chromatogram of 0.2 × 10⁻⁸g of RDX deposited on the grid concentrator of the EKHO-M from acetone solution. 1 – RDX, 2 – acetone with no sample. The insert shows a value of a background signal where the RDX peak escapes.
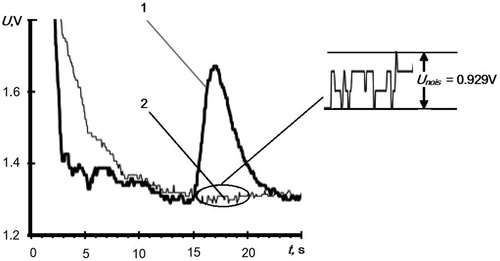
Figure 3. RDX peak amplitude versus the amount of the sample deposited on the concentrator. Dotted line shows minimum detectable signal ULOD = 3×Unois = 0.087 V.
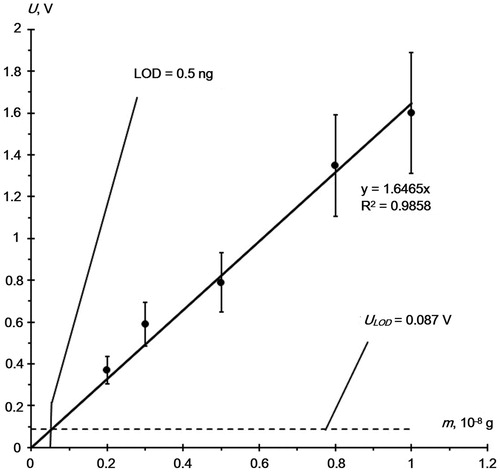
Table 1. Working values of spatial and gas-dynamic parameters.
Figure 4. RDX signal versus the flowrate of the spray solvent upon desorption from the smooth glass surface.
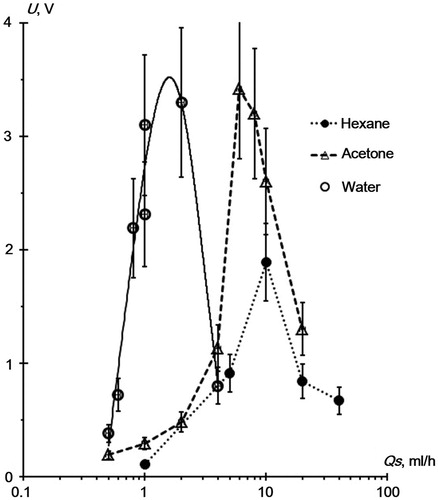
Table 2. Solvent flowrate upon spray corresponding to the maximum RDX signal.
Figure 5. Picture of an aerosol plume interacting with the surface upon the RDX desorption from the glass surface by water aerosol. (a) Qs = 2 mL/h, (b) Qs = 4 mL/h. 1 – nebulizer nozzle, 2 – region of continuous solvent film. (Nebulizer nozzle (1) of 2 mm defines an image scale.)
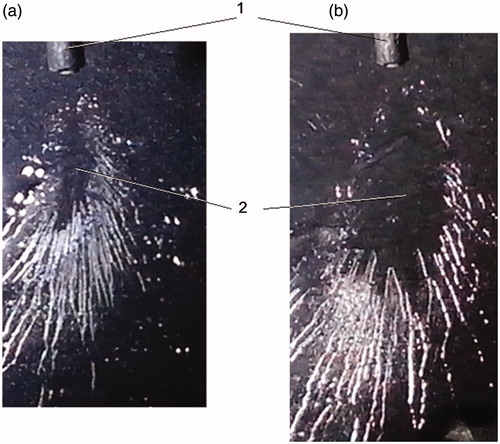
Figure 6. RDX signal upon desorption from different substrates by acetone spray.
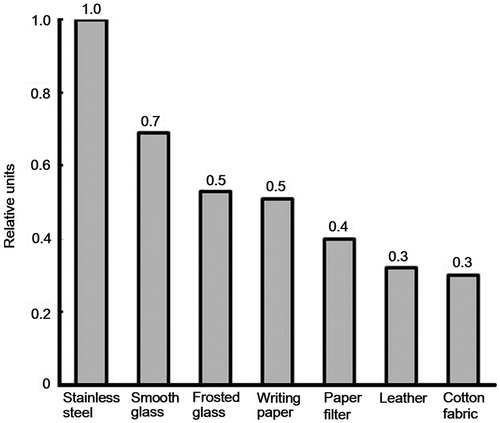
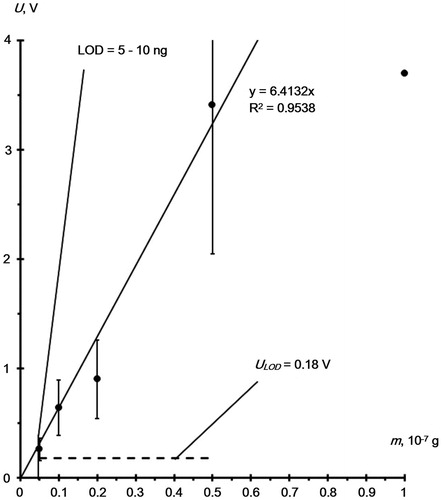
Figure 7. RDX peak amplitude (U) versus amount (m) of RDX deposited on the smooth glass surface. Dotted line shows minimum detectable signal, ULOD = 3×Unois = 0.18 V.