Figures & data
Figure 1. Schematic of the NanoCharger system, including ion source, and NanoCharger with growth tube, ion scavenger, and concentrator/evaporator.
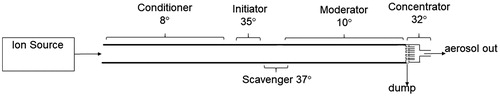
Figure 2. (a) Tandem DMA setup for testing NanoCharger using a downstream water CPC switched between conditioned and bypass lines. (b) Experimental setup for assessing potential for chemical artifacts.
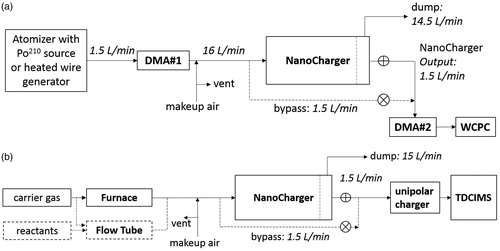
Figure 3. Model calculations of the saturation ratio, temperature and dew point in the center of the flow for the NanoCharger, with wall temperatures for the conditioner, initiator, scavenger and moderator of 8 °C, 35 °C, 37 °C, and 10 °C, respectively.
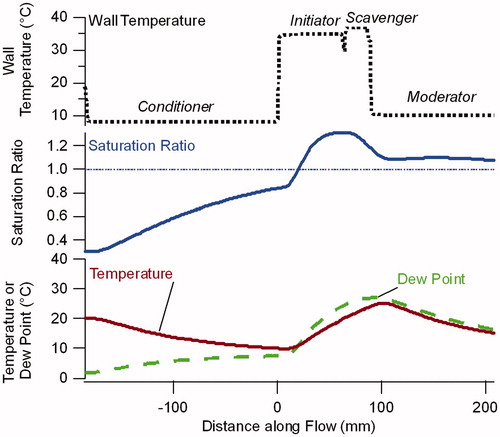
Figure 4. Comparison of particle size distributions for 17 nm sulfate particles directly exiting the NanoCharger, and after passing through a 50 °C postheater. In both instances data are obtained without an ion source. Distributions are normalized by the input size distribution number concentration.
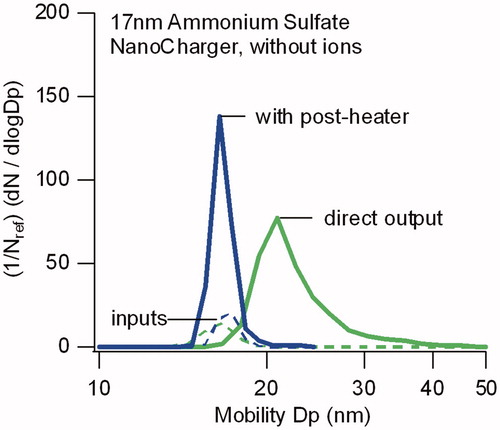
Figure 5. Comparison of input and output particle size distributions for operation of the NanoCharger without an ion source, and with postheater. Enrichment in particle concentration is due to the NanoCharger concentrator stage.
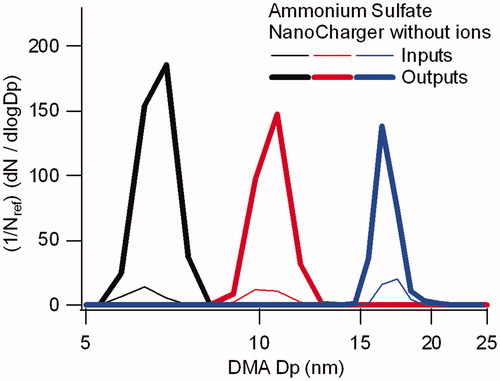
Figure 6. Single-charge equivalent mobility distribution for 10 nm ammonium sulfate particles exiting the NanoCharger operated with a soft X-ray bipolar ion source upstream. Distributions are normalized with respect to the bypass line, which sampled the aerosol downstream of the ion source, before entering the NanoCharger. Singly charged particles appear at the selected mobility size, multiply charged particles appear at smaller mobility diameters. Charge level for each peak is noted. Application of voltage to the ion scavenger reduces multiply charged particles.
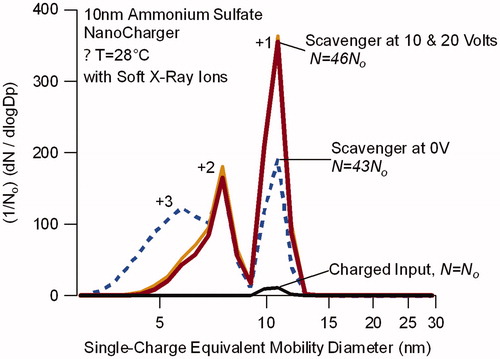
Figure 7. Single-charge equivalent mobility distribution for mobility-selected nichrome wire generated particles after passing through a 210Po bipolar ion source (charged input) and after subsequently passing through the NanoCharger (colored lines). Input particle size is 9.5 nm. Distributions are normalized with respect to the line bypassing the NanoCharger (labeled charged input). NanoCharger conditioner and initiator are at 8 °C and 35 °C.
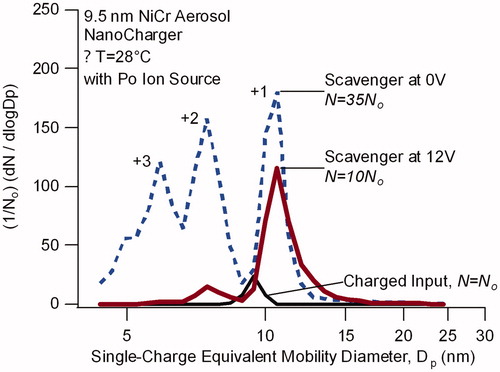
Figure 8. Fraction of ammonium sulfate particles exiting, and entering the NanoCharger that carry either +1 or –1 electrical charge.
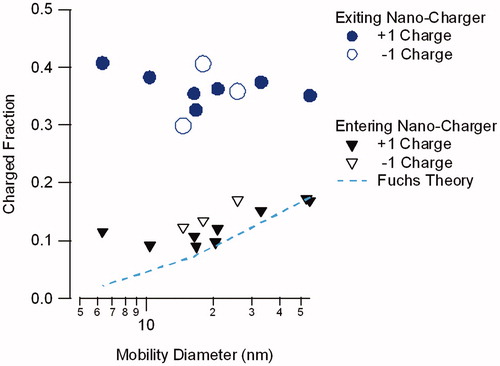
Table 1. Particle concentration ratios for the NanoCharger.
Figure 9. Representative TDCIMS negative ion mass spectra of 20 nm diameter ammonium sulfate aerosol particles charged with the nanocharger (a) and bypassing the nanocharger (b).
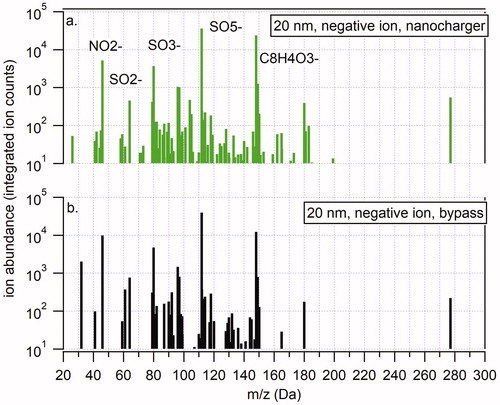
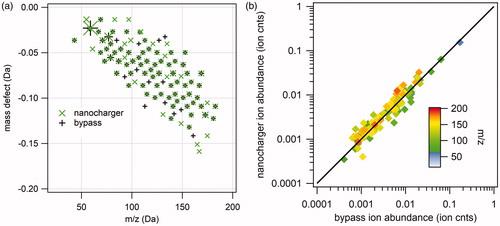
Figure 10. Analysis of 20 nm diameter ammonium sulfate negative ion mass spectra. (a) Kendrick mass defect analysis of nanocharger-exposed (green) and bypass aerosol mass spectra. Symbol size corresponds to ion intensity. (b) Correlation between nanocharger-exposed ion abundance and bypass aerosol ion abundance.
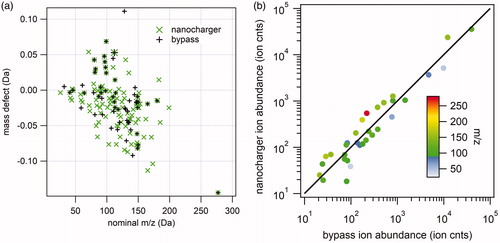
Figure 11. Analysis of 25 nm diameter α-pinene SOA negative ion mass spectra. (a) Kendrick mass defect analysis of nanocharger-exposed (green) and bypass aerosol mass spectra. Symbol size corresponds to ion intensity. (b) Correlation between nanocharger-exposed ion abundance and bypass aerosol ion abundance.
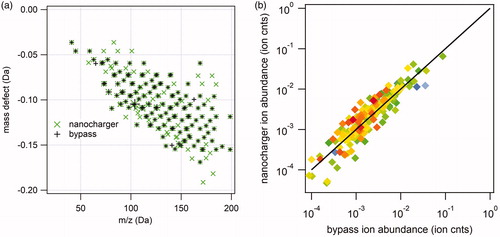
Figure 12. Analysis of 25 nm diameter α-pinene SOA positive ion mass spectra. (a) Kendrick mass defect analysis of nanocharger-exposed (green) and bypass aerosol mass spectra. Symbol size corresponds to ion intensity. (b) Correlation between nanocharger-exposed ion abundance and bypass aerosol ion abundance.