Figures & data
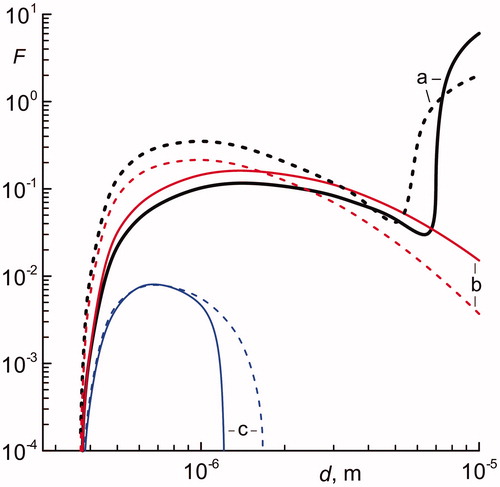
Figure 1. Schematic representation of the ESP consisting of nine wire anodes, ten plate cathode electrodes with rods, and nine plate repelling electrodes. An applied dc gap voltage and a variable speed fan drive produce the measured wind V (→). The constructive and flow parameters are given in .
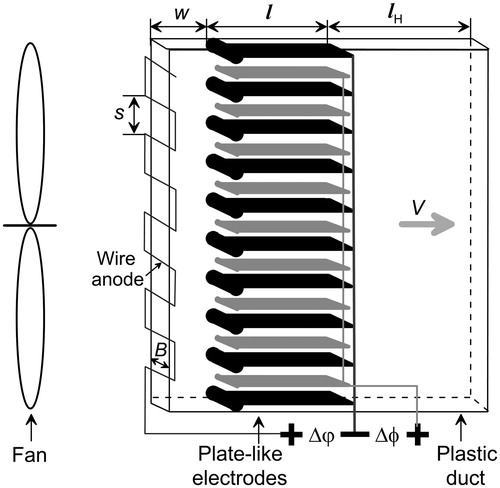
Table 1. Parameters of the ESP (see ).
Figure 2. Calculation domain of the ESP.
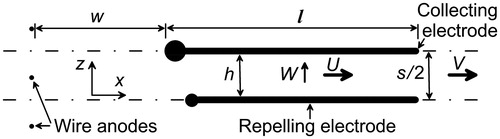
Figure 3. Typical image of the collecting electrode surface. The transverse size of the image is about 1 mm.
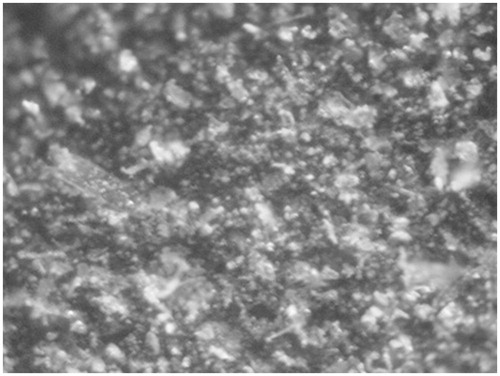
Figure 4. Cumulative particle size distribution of the indoor dust, together with the 95% standard deviation bars.
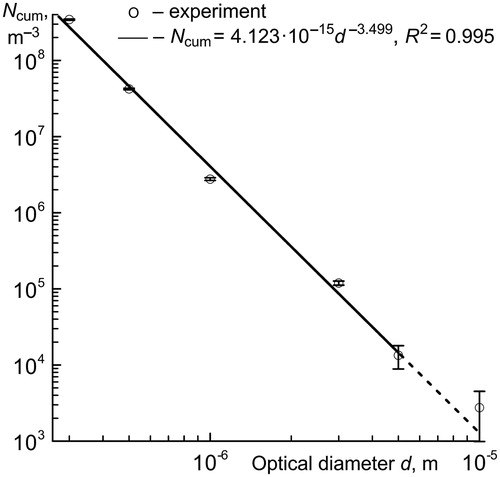
Table 2. Data for the particle size distribution.
Figure 5. Comparison of the particle penetration between the analytic predictions (lines) and the experimental data with the standard deviation bars for the particle size ranges respectively 0.3–0.5 μm (square symbols) and 1.0–3.0 μm (circle symbols) at the various airflow velocities for the clean (open symbols) and dust-loaded (filled symbols) collecting electrodes. Analytical predictions of particle penetration for the probability of reflection of charged particles p = 0 are shown by solid lines and for the probabilities p = 0.24 and p = 0.11 calculated by Harris and Davidson (Citation2009) for particle diameters about 0.359 and 1.361 microns are shown by dashed and dotted lines, respectively.
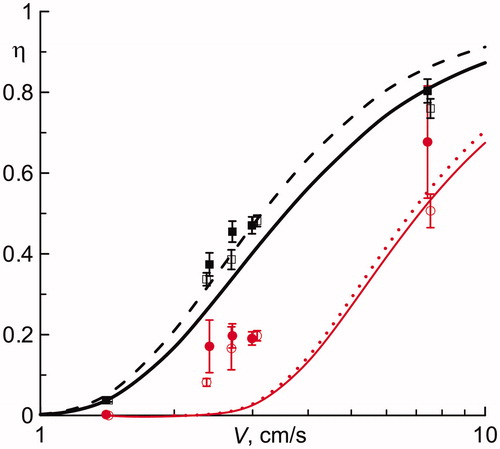
Figure 6. Comparison of the particle penetration between the analytic predictions (lines) and the experimental data, with the standard deviation bars, at the various airflow velocities V for the clean (open symbols) and dust-loaded (solid symbols) collecting electrodes. ––– – the particle reentrainment is missing; - - - - – the particle reentrainment flux is defined by Equations (Equation35(35) ) and (Equation37
(37) ).
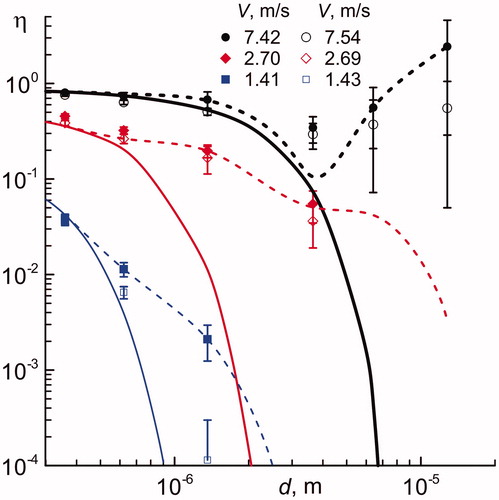
Figure 7. Estimations of the cumulative reentrainment fluxes from the dust-loaded electrode surface under two extreme assumptions: reentrained particles are not charged (solid lines) and they are charged as precharged particles in the deposition flux (dashed lines).
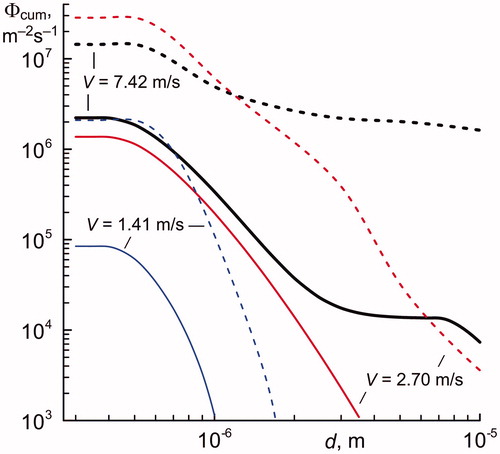
Figure 8. The dimensionless velocity F(d) for the reentrainment flux of fully discharged (solid lines – Equation (37)) and fully charged particles (dashed lines – Equation (42)) from the dust-loaded electrode surface. (a) – u* = 0.730 m/s (V = 7.42 m/s), (b) – u* = 0.316 m/s (V = 2.70 m/s), and (c) – u* = 0.211 m/s (V = 1.41 m/s).