Figures & data
Figure 1. Experimental setup schematic to measure the CPC residence time distribution.
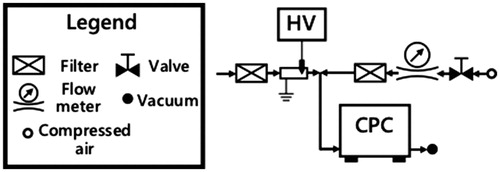
Figure 2. Experimental setup schematic to measure the DMA-CPC composite instrument response.
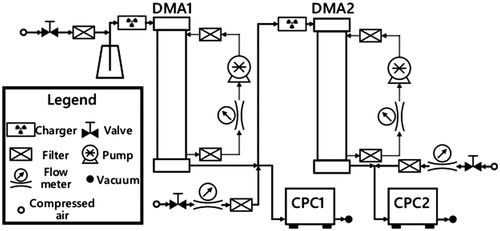
Table 1. Operating parameters for the scanning DMA.
Figure 3. Residence time distribution of TSI 3010 CPC, with sampling flow rate of 0.975 LPM.
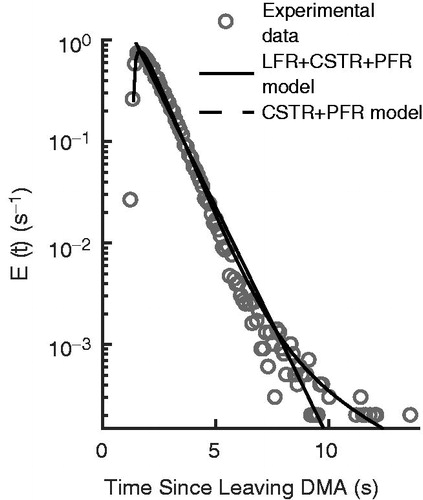
Figure 4. Up-scan experimental and modeling results for SEMS instrument response to monodisperse 147 nm particles with ramp duration = 10, 20, 45, and 90 s (corresponding to scan time
= 1.54, 3.08, 6.94, and 13.9 s).
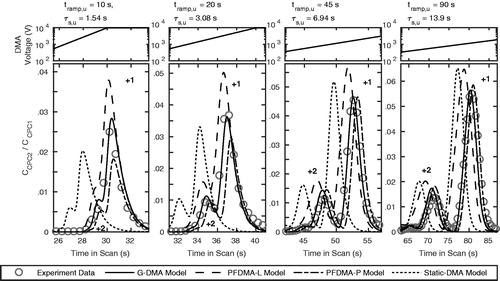
Table 2. Penetration efficiencies through the flow system for the geometric model (G-DMA) for various particle sizes.
Figure 5. Down-scan experimental and modeling results for SEMS instrument response to monodisperse 147 nm particles with ramp duration = 10, 20, 45, and 90 s (corresponding to scan time
= 1.54, 3.08, 6.94, and 13.9 s).
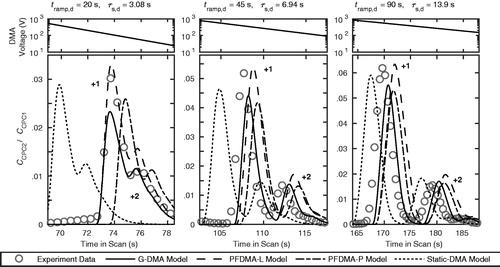
Figure 6. The instantaneous scanning DMA transfer functions , the instantaneous SEMS transfer functions
, and the cumulative SEMS transfer functions
for up-scan operation with ramping durations
(a) 45 s, (b) 240 s, which correspond to scanning time scales
6.94 s, 37.00 s, respectively. Samples of the transfer functions are shown for singly-charged particles with electric mobility equivalent sizes ranging from 22.5 nm to 433 nm.
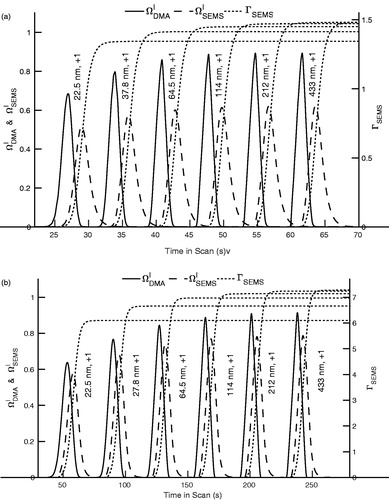
Figure 7. Comparison of the experimentally measured and the simulated total number concentration ratios between up- and down-scan operation. Error bars represents the standard deviations for the corresponding experimental measurement results.
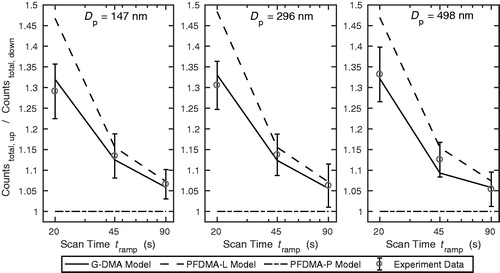
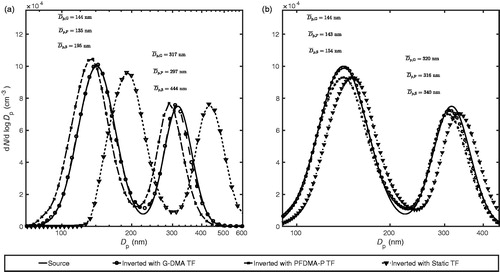
Figure 8. Comparison of the inverted size distribution with G-DMA model, PFDMA-F model, static DMA transfer function and the source particle size distribution in the (a) 45 s ramp and the (b) 240 s ramp. , and
denote the mean particle sizes from G-DMA model, PFDMA-F model, static DMA transfer function-based inversion and for different modes of the size distribution, respectively.