Figures & data
Figure 1. TDMA flow chart. Pressures and temperatures used to determine the designed orifice flows rates are noted. The sample inlet is at the top left, and the conditioning area is shaded. The two DMAs are labeled and shaded. Particle counting is at the bottom right.
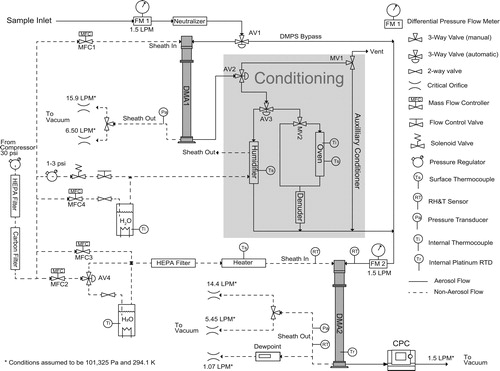
Figure 2. Sizing accuracy between the two DMAs. The data presented is the result of comparing the diameters of DMA1 and DMA2. In the legend, the first high/low represents the DMA1 sheath flow while the second high/low represents the sheath flow in DMA2 (e.g. squares are with DMA1 in low flow while DMA2 is in high flow). Error bars are the 95% confidence intervals of the mean value. Grey area represents error from PSL experiment at 203 nm. Dashed lines indicate the desired ±2% error.
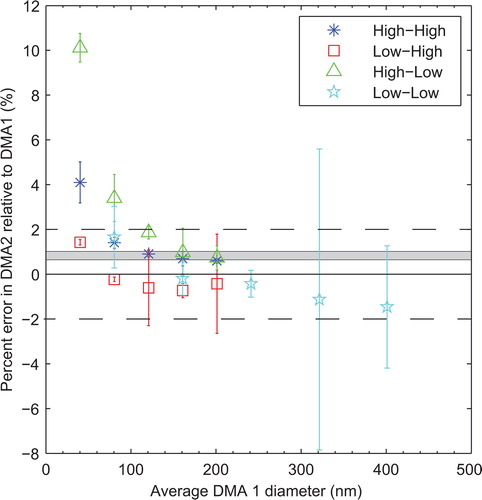
Figure 3. Comparison of the TDMA DMPS channel to a TSI SMPS 3696. The DMPS high flow denotes that the sheath flow rate is high, and DMPS low flow denotes that the DMA2 sheath flow is low. SMPS (TDMA high) and (TDMA low) denotes the comparison dataset, for example, DMPS high flow taken simultaneous to SMPS (TDMA high). Since nothing changed with the SMPS instrument or experimental setup between high and low flow experiments, the two SMPS measurements should equate. M0 in the table denotes the zeroth moment of the distributions evaluated between 20 and 240 nm. M1/M0 is the number based average diameter evaluated over the same range.
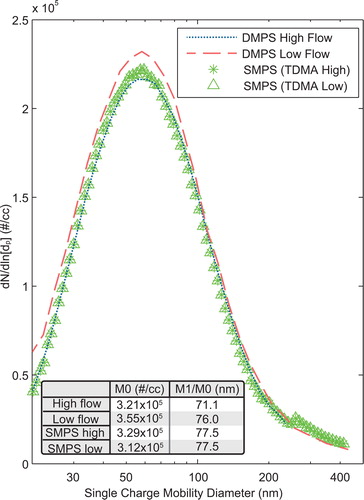
Figure 4. Error in relative humidity and growth factor over 4 h at laboratory conditions while operating under dew point control. The short dashed line represents the measured relative humidity, calculated from the dew point temperature and the measured absolute temperature. The long dashed line is the measured growth factor. The solid line is the calculated relative humidity from the growth factor measurements. Oscillations were caused by changes in room temperature.
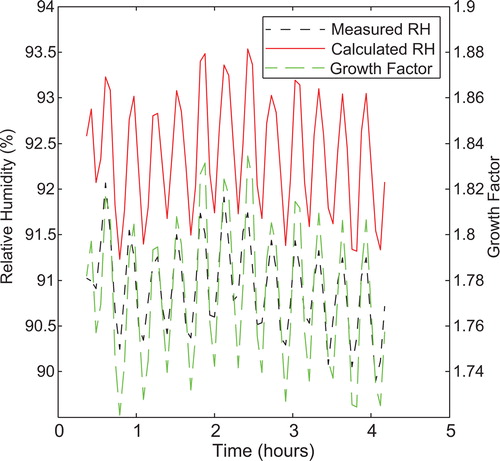
Table 1. Measured hygroscopicities of six standards.
Figure 5. Panel A: Comparison of measured saturation vapor pressure values of atomized diacids at room temperature against those measured by Bilde et al. The x-axis is the length of the carbon chain (e.g. 6 is adipic acid). The line is used to display the “sawtooth” pattern resulting from the measurements by Bilde et al. Panel B: Measured enthalpies of sublimation compared to Bilde et al and mass effusion techniques. The connected asterisks are from Bilde et al. The triangles are the results from mass effusion techniques. Unconnected asterisks are measured by the TDMA. The error bars represent the 95% confidence intervals resulting from the linear curve fits displayed in .
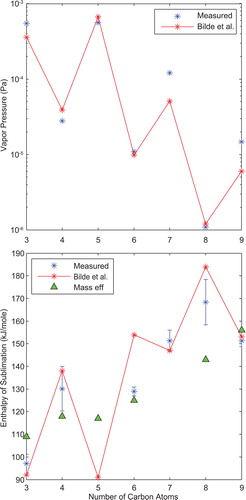
Table 2. Volatility data from the TDMA along with data from Bilde et al and Mass Effusion.
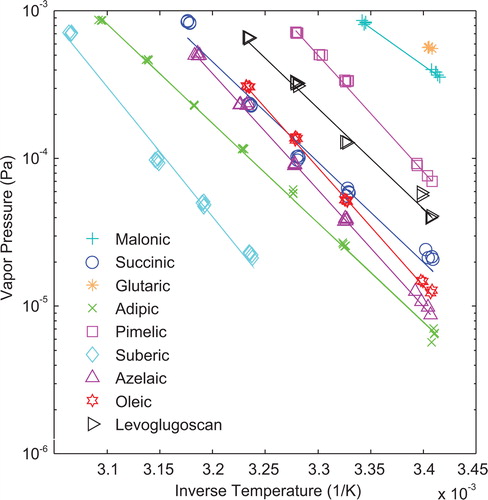
Figure 6. Saturation vapor pressures and Clausius-Clapeyron equation fits for all evaluated compounds. Each line is a least squares curve fit of the recorded data. For glutaric acid, only a single data point is recorded. The upper saturation vapor pressure measurement limit for the instrument is approximately 9.1 × 10⁻⁴ Pa, while the lower measurement limit is approximately 6.1 × 10⁻⁶ Pa. The minimum elevated temperature is 28 °C or 3.32 × 10⁻³/K.