Figures & data
Figure 1. TEM images of ethylene soot (a–b) before laser heating and after laser heating at a fluence (c–d) 75 mJ/cm2, (e–f) 150 mJ/cm2.
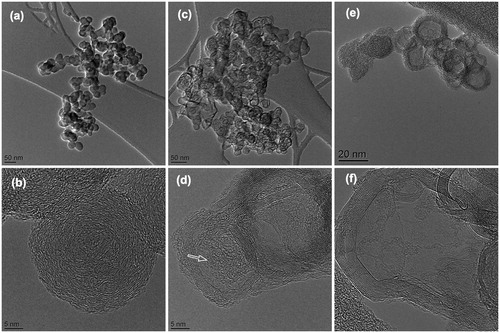
Figure 2. TEM images of lamp black (a–b) before laser heating and after laser heating at a fluence (c–d) 75 mJ/cm2, (e–f) 150 mJ/cm2.
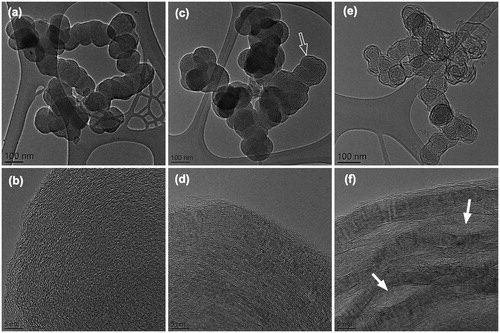
Figure 3. HRTEM images of R250 carbon black (a) before laser heating and (b) after laser heating at a fluence of 150 mJ/cm2.
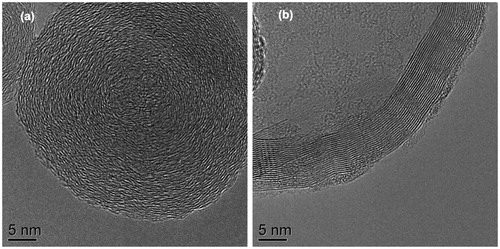
Figure 4. Representative HRTEM images of (a) nascent and (b) laser heated (150 mJ/cm2), arc soot.
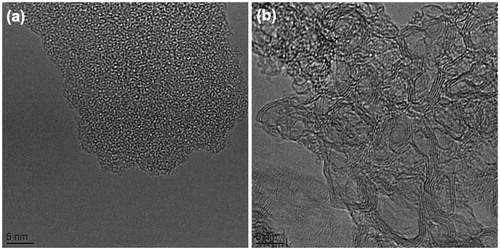
Figure 5. Representative HRTEM images of (a) nascent and (b) laser heated (150 mJ/cm2), M1300.
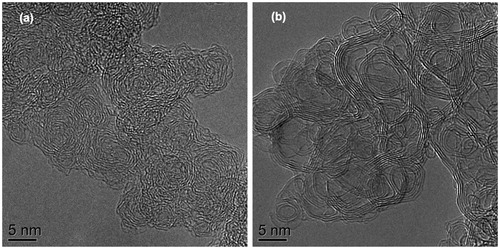
Figure 6. HRTEM images of diesel soot (a) before laser heating and (b) after laser heating at a fluence of 150 mJ/cm2.
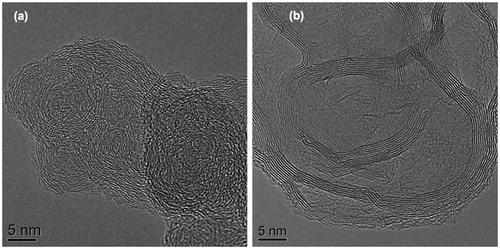
Figure 7. HRTEM images of gasoline soot (a) before laser heating and (b) after laser heating at a fluence of 150 mJ/cm2.
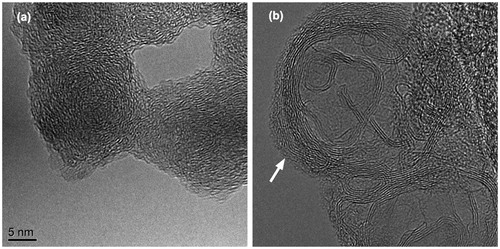
Figure 8. HRTEM images of soot generated from a classic wood boiler (a) before laser heating and (b) after laser heating at a fluence of 150 mJ/cm2.
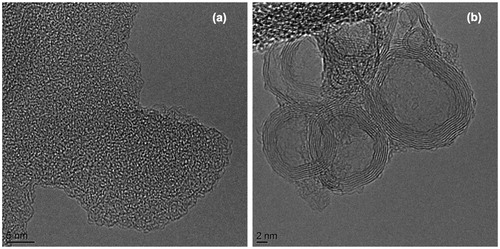
Figure 9. Survey HRTEM images of soot collected from the Gulf oil spill study. (a and b) nascent particles and (c and d) after laser heating at a fluence of 150 mJ/cm2.
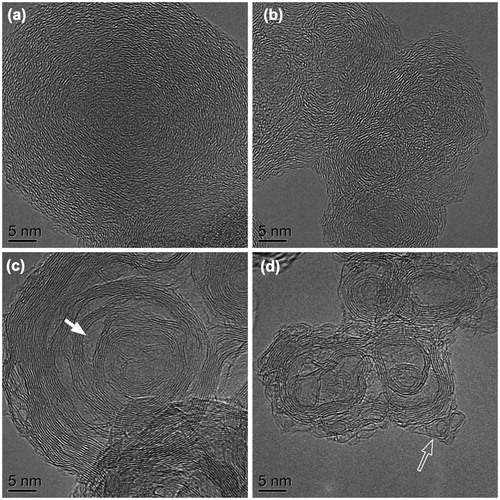
Figure 10. Illustration of fringe length and tortuosity distributions for nascent and laser annealed carbon.
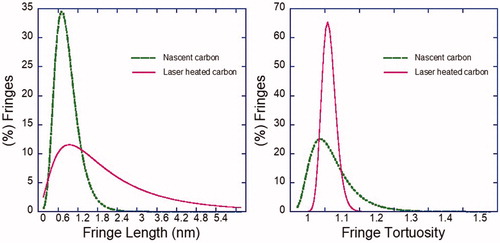
Figure 11. Comparison of median fringe length and tortuosity values across the different soots, before and after laser annealing.
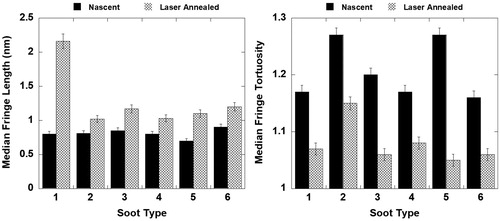
Figure 12. Stack analysis for nascent and laser annealed R250 and Lamp Black.
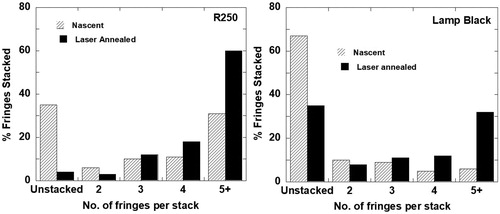
Figure 13. Void area selection for (a) diesel and (b) gasoline soot.
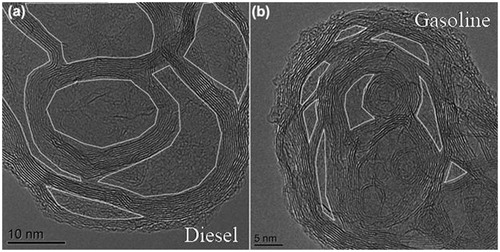
Figure 14. Void area quantification for diesel and gasoline soot.
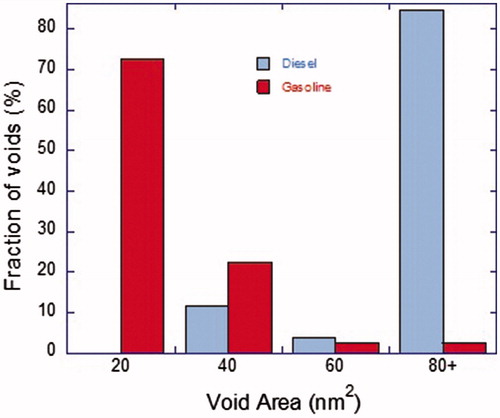
Figure 15. Low magnification TEM images of R250 carbon (a and b) nascent and (c and d) laser annealed.
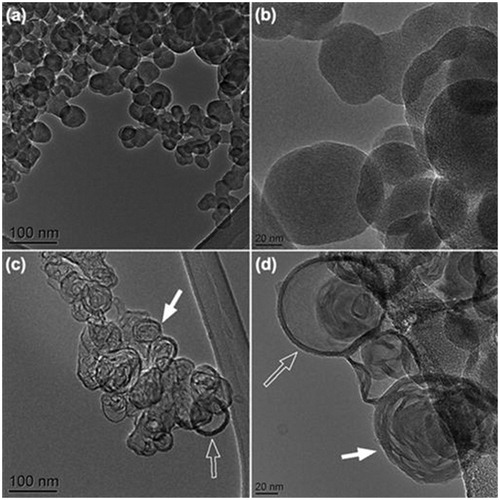
Figure 16. Laser annealed R250 showing different nanostructure evolution—(a) particles with internal structures, (b) hollow shells.
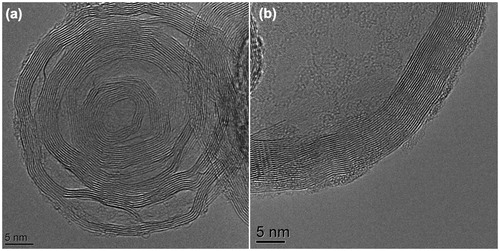
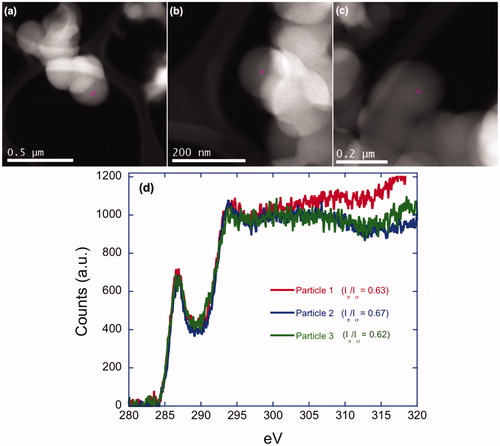
Figure 17. HAADF images of R250 particles along with crosshairs show the beam position of respective images.
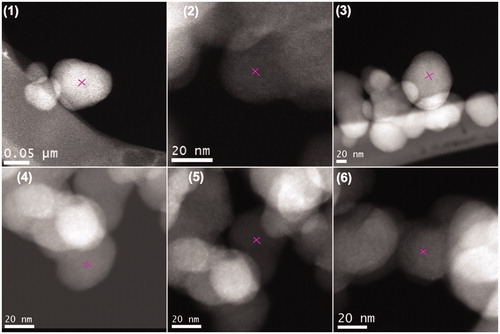
Figure 18. Overlaid EELS spectra of the R250 particles.
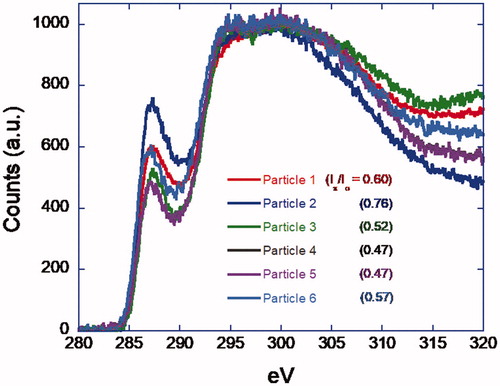
Figure 19. (a–c) HAADF images of lamp black particles along with crosshairs show the beam position of respective images. (d) Overlaid EELS spectra of the lamp black particles.