Figures & data
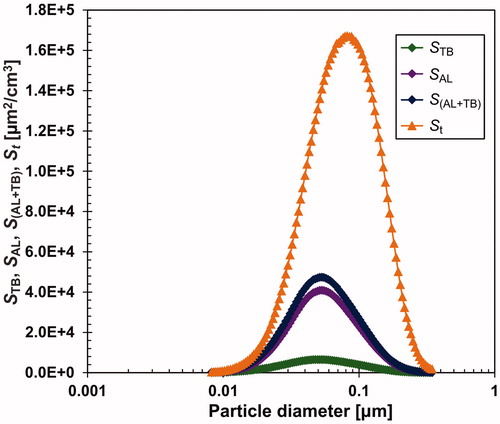
Figure 1. Scheme of the apparatus. (1) Deoxygenator, (2) dryer, (CV) control valve, (D) diluter, (F) filter, (MFC) electronic mass flow controller, (N) aerosol neutralizer Am241, (P) pressure reducing valve, (SF) sampling filter, (VP) vacuum pump.
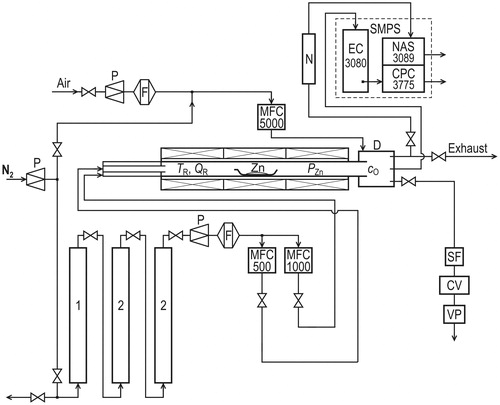
Figure 2. The dependence of Nt, GMD, St, Mt, and number, mass and surface particle size distributions on the process duration and the experimental conditions (TR, QR, QDil, cO) during the 1st experimental run. Vertical gray bars highlight the sampling periods; G denotes the TEM grid, F denotes Ag filter, and FC denotes cellulose filter.
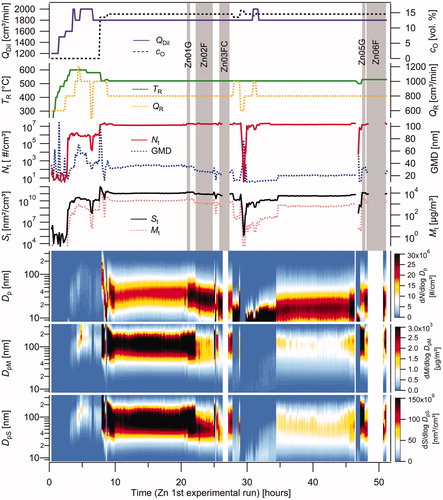
Figure 3. Variation in the particle size distribution during the 1st experimental run depending on different events.
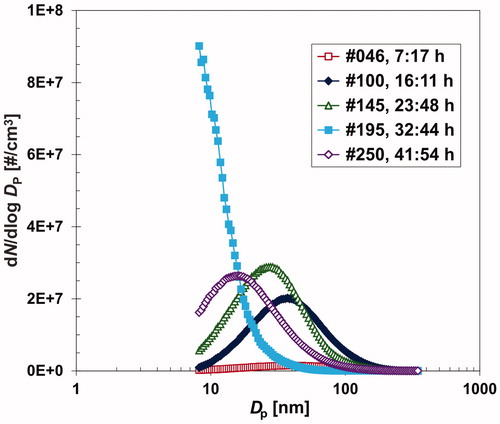
Table 1. Experimental conditions, mass concentrations, and emission rates from the filter and SMPS measurements during the filter sampling periods.
Figure 4. TEM images of sample Zn01G synthesized at TR=520 °C, QR=800 cm3/min and QDil=1800 cm3/min.
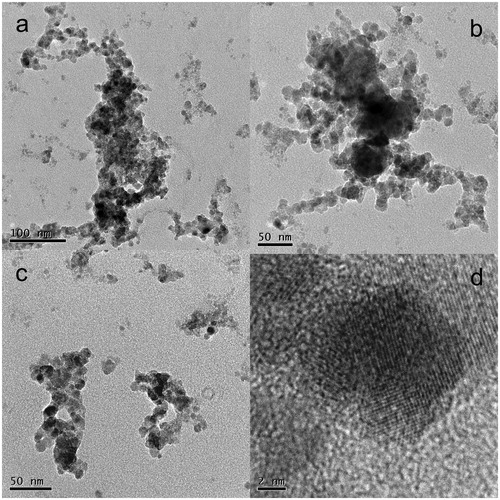
Figure 5. TEM images of sample Zn05G synthesized at TR=530 °C, QR=800 cm3/min and QDil=1800 cm3/min.
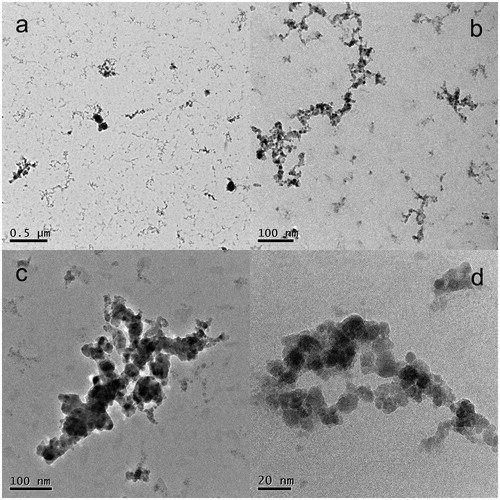
Figure 6. XRD pattern of sample Zn06F synthesized at TR=530 °C, QR=800 cm3/min and QDil=1800 cm3/min. C denotes chlorargyrite, S silver, and Z zinc oxide.
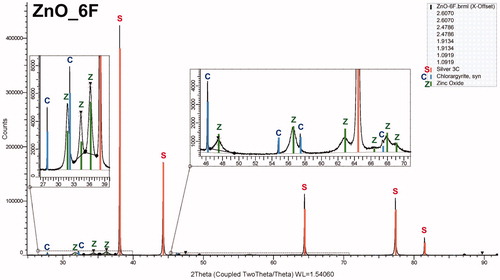
Figure 7. Comparison of the electron diffraction pattern (inset and the (red) curve) of sample Zn01G (TR=520 °C, QR=800 cm3/min and QDil=1800 cm3/min) with the model diffraction pattern of hexagonal ZnO (the vertical (green) lines), PDF 05-0664.
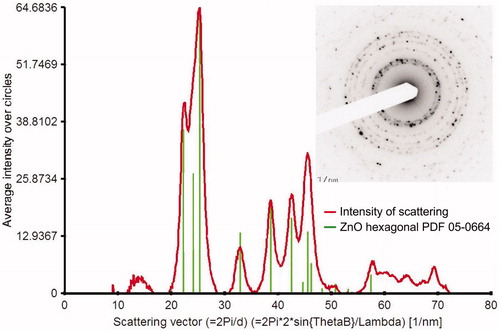
Figure 8. Surface particle size distribution of the generated aerosol (St) and surface distributions of fractions deposited in the tracheobronchial (STB) and alveolar (SAL) regions and LDSA (SAB+TB). Concentrations St, STB, SAL and SAB+TB are plotted in the form dS/dlog Dp.