
Figures & data
Schematic representation of electrospinning.
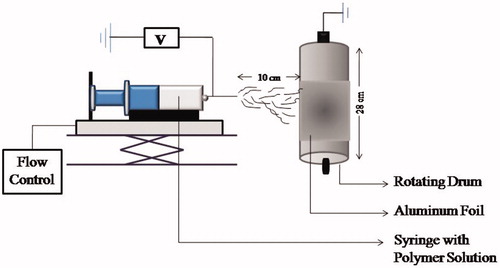
Figure 2. Schematic representation of Andersen sampler.
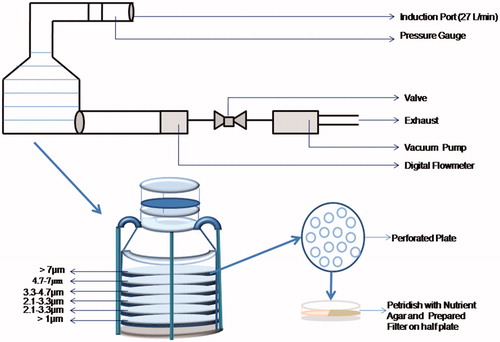
Figure 3. FTIR graph of (a) PVDF nanofibers and (b) PVDF + 15 wt% Ag nanofibers.
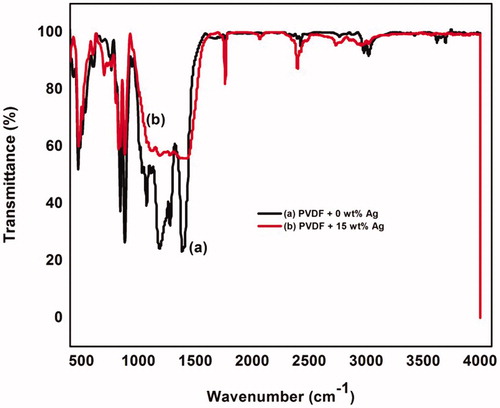
Figure 4. UV-visible spectroscopy of silver nanoparticles (a) 5 wt% Ag, (b) 10 wt% Ag, (c) 15 wt% Ag.
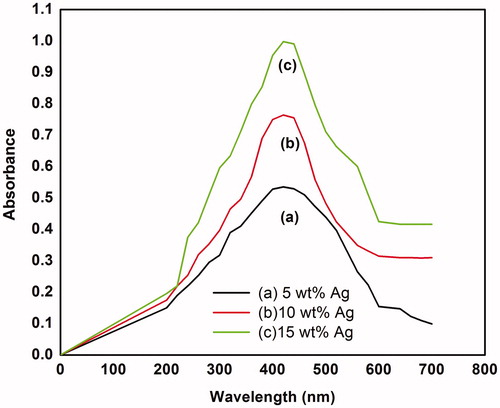
Figure 5. TGA curve of PVDF + 15 wt% Ag nanofibers.
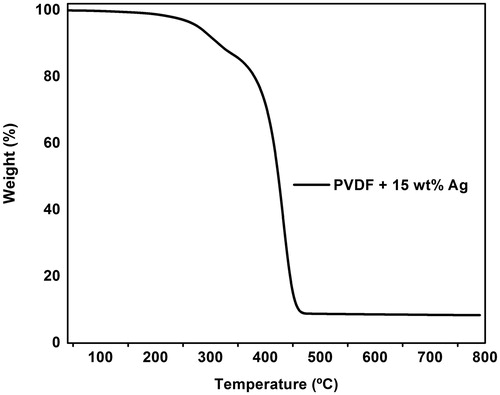
Figure 6. Zone of inhibition produced by PVDF + 0 wt% Ag and PVDF + Ag nanofibers (5, 10, 15 wt%) against Gram positive and negative bacteria for 24 h.
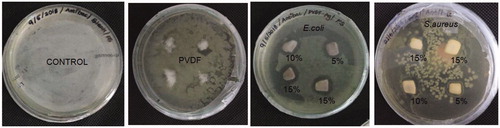
Table 1. Zone of inhibition produced by Gram positive and Gram negative bacteria.
Figure 7. (a) Anti-bacterial activities against E. coli (b) Anti-bacterial activities against Staphylococcus aureus.
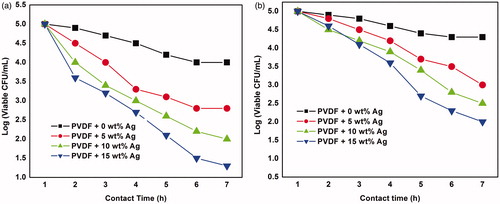
Figure 8. Bacterial filtration efficiency versus aerosol particle size.
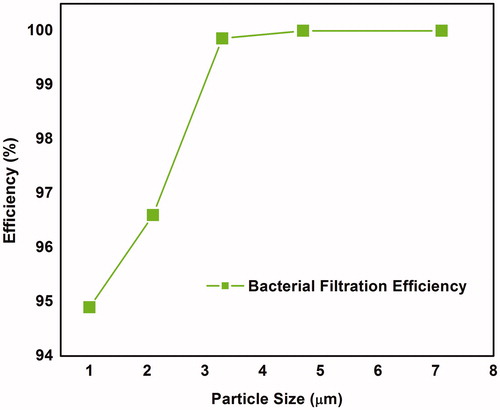
Figure 9. (a) Contour plot of efficiency with respect to silver concentration and areal density, (b) contour plot of efficiency with respect to silver concentration and time, (c) contour plot of efficiency with respect to time and areal density.
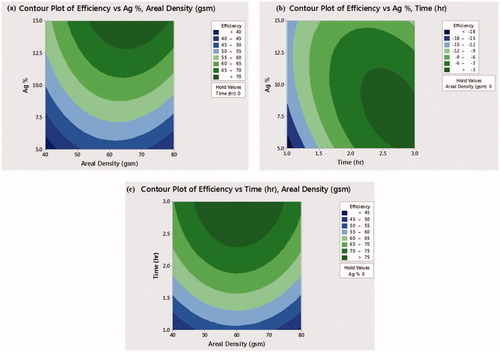
Table 2. Bacterial filtration efficiency produced through the experimental runs.