Figures & data
Figure 1. Design of ALI exposure device.
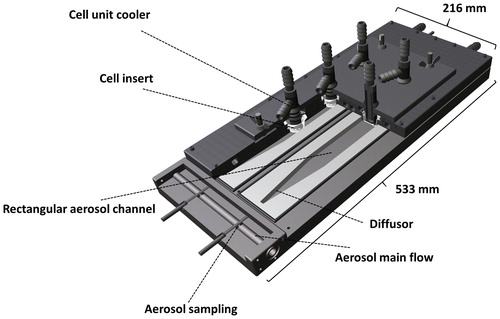
Figure 2. Ag particle generation method and a micrograph of Ag particles measured with SEM.
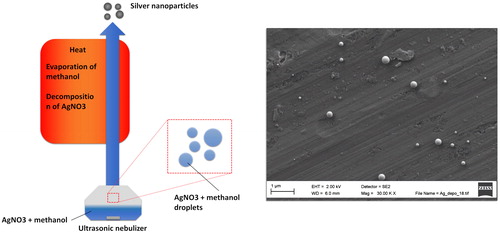
Figure 3. (a) ZnO generation method and (b) typical size distributions with varying reactor temperature.
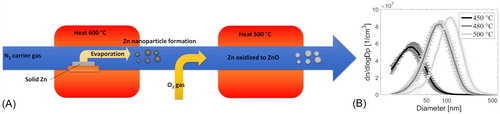
Table 1. Properties of diluted wood combustion exhaust used in each cell exposure experiment. For online measurements, averages, and standard deviations over the exposure periods are shown.
Figure 4. Analytical and numerically simulated deposition velocities.
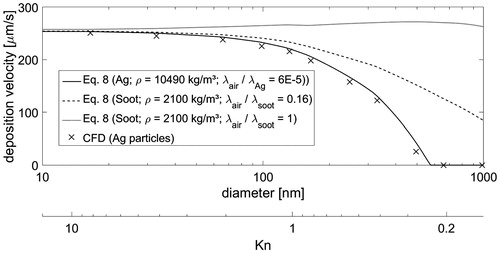
Figure 5. Micrographs of (a) deposited Ag particles (SEM) at two magnifications, (b) typical ZnO particle (TEM) applied in this study, and (c) deposited ZnO particles (SEM).
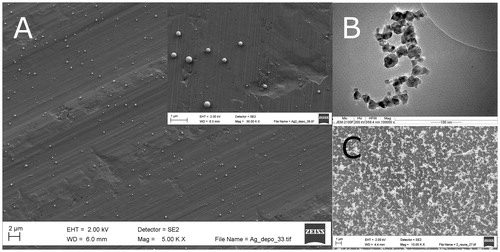
Figure 6. Ag particle population measured in aerosol phase (SMPS) and from aluminum foil (SEM). Approximately 350 Ag particles were analyzed from SEM micrographs to obtain the size histogram.
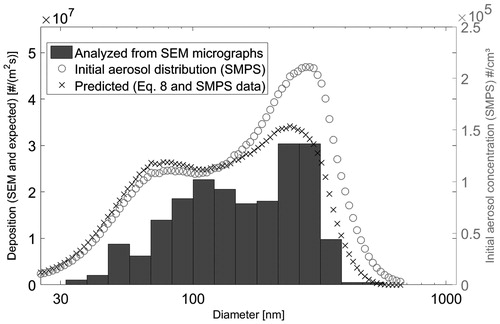
Figure 7. Deposition uniformity study by counting the particle coverage from SEM micrographs at four different locations. At middle locations, three samples (nearby locations) were analyzed. At “2nd edge” location, the number of sample analyzed was one. The average values and their standard deviations are shown.
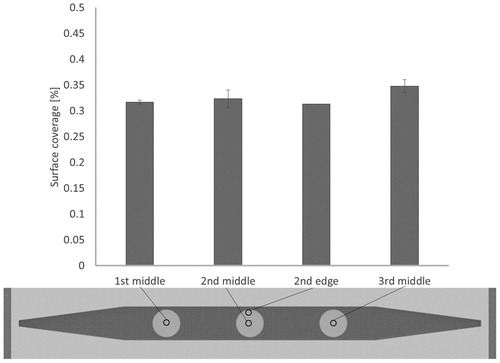
Table 2. Calculated cell exposure dose.
Figure 8. Cell viability of A549 assessed with the PI exclusion assay after exposure of the cells in the thermocollector. Each bar represents the average of four samples with SEM.
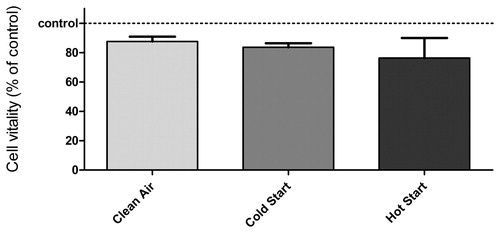
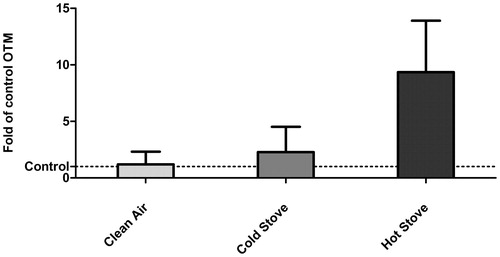
Figure 9. A549 cell DNA damage assessed with the Comet assay after exposure in the thermocollector. Each bar represents the average of two samples OTM fold difference of control mean with SEM.