Figures & data
Figure 1. An example of the molecular dynamics simulation, 200 nitrogen gas molecules and an ion (TAA or PEG). The arrows are electric field direction of each component (Ex, Ey, and Ez) and total one (E).
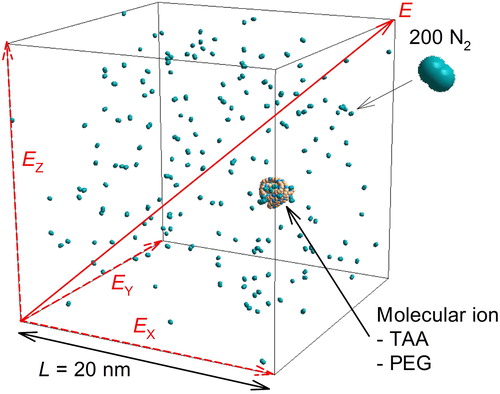
Table 1. Calculation conditions for the TAA and PEG molecules.
Table 2. Partial charges on the PEG and NH4 molecules.
Figure 2. Position of z charged PEG3,538 ion and nitrogen gas molecules against time in the simulation cell, (A) z = 1 (B) z = 5, (C) z = 7.
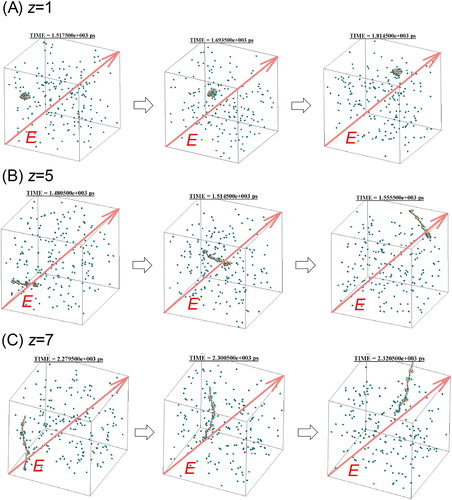
Figure 3. Time variation of electrical velocity of singly charged PEG3,538. Open circle and solid line represents the simulation result and the theoretical velocity.
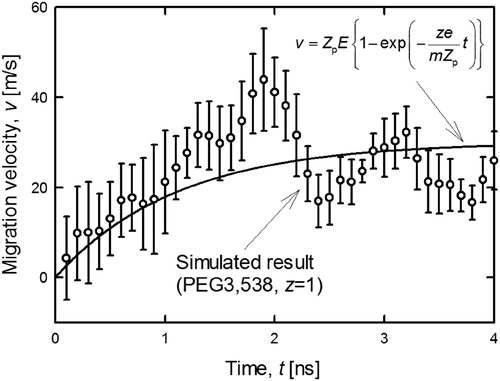
Figure 4. Molecular weight dependence of electrical mobility: experimental, simulated, and theoretical.
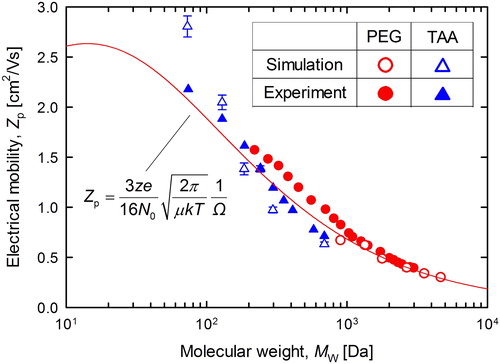
Figure 5. Migration velocity per charge number of PEG3,538 ion against time. Open/Closed symbols and solid line were represented singly/septuple charged ion and the experimental migration velocity (Ude, Fernandez de la Mora, and Thomson Citation2004), respectively. The vertical axis of the 7-charged ion was set to be 1/7 of the simulated migration velocity (velocity per charge) for comparison.
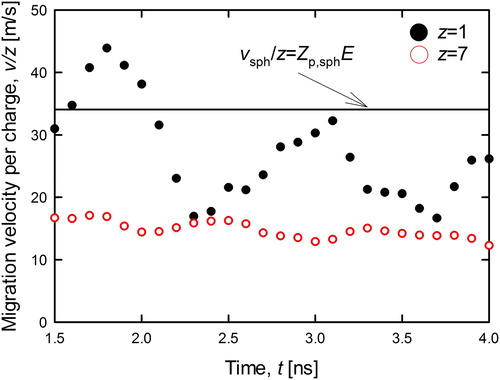
Figure 6. Relationship between the electrical mobility and charge number (PEG3,538).
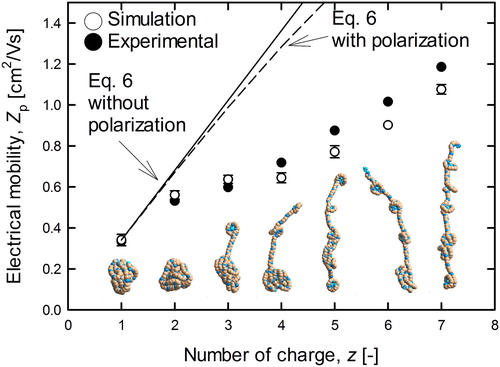
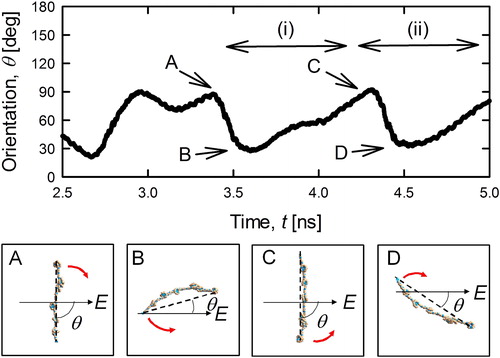
Figure 7. Time dependence of the orientation of the 7-charged PEG3,538 ion (upper subfigure) and the conformations and the orientation of PEG ion at the specific calculation time A, B, C and D (lower subfigure).