Figures & data
Figure 1. Diagram of the test rig used to generate and sample the experimental bioaerosols. QG: bubbling airflow; QE: entraining airflow; T: temperature of air; RH: relative humidity of air; CFC: closed-face cassette; MARPLE: cascade impactor.
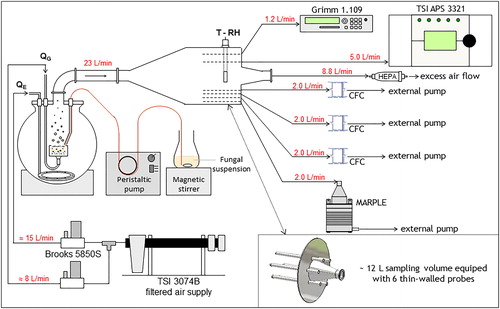
Table 1. General generation runs data.
Figure 2. Size distribution of airborne particles in the bioaerosol generated from a liquid consortium of the four fungal strains. The aerodynamic diameter was measured using (A) the TSITM APS 3321 (normalized number size distribution); (B) the Marple Cascade Impactor (normalized number of CFU, total number of CFUs measured when considering all the stages = 2.7 × 10⁶ CFU/m3).
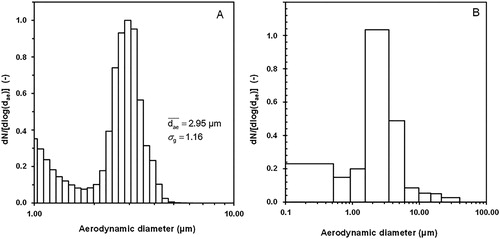
Figure 3. Fungal biodiversity in the mixed bioaerosols found using several methods. The value of each fungal proportion correspond to the mean of proportions found in the three mixed bioaerosols.
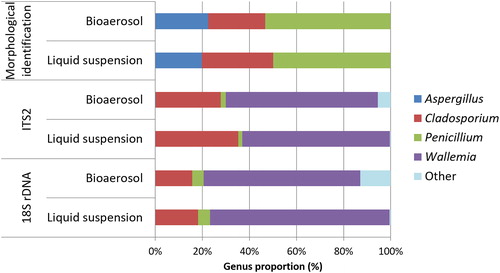
Figure 4. Fungal biodiversity in the mixed bioaerosols and liquid suspensions found using morphological identification after culture, 18S rDNA and ITS2 sequencing. The value for each fungal proportions corresponded to the mean of proportions found in the three bioaerosols and the corresponding liquid suspension.