
Figures & data
Figure 1. Various types of size distributions generated from EquationEquation (11)(11)
(11) .
![Figure 1. Various types of size distributions generated from EquationEquation (11)(11) n(v,t)=N(t)62πv ln σ′(t)[exp (− ln 2(v/vg1(t))18 ln 2σ′(t))+ exp (− ln 2(v/vg2(t))18 ln 2σ′(t))],(11) .](/cms/asset/ada0b0fc-8139-455c-ad0e-2ae55d1f8021/uast_a_1562152_f0001_b.jpg)
Table 1. Values of ,
, and
for various
.
Table 2. Variations of the zeroth moment, , and the second moment,
, with time predicted by various methods in the continuum regime.
Figure 2. Relative error of for the LNMOM, the ELNMOM and the TEMOM for different initial cases in the continuum regime: (a)
=1.1; (b)
=1.4; (c)
=1.7.
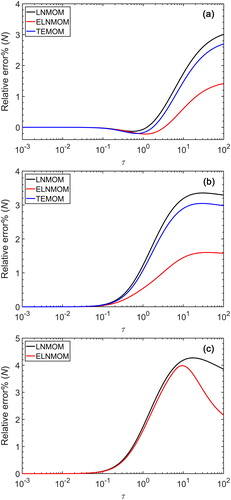
Table 3. Maximum relative error of for the LNMOM, the ELNMOM and the TEMOM for different initial cases in the continuum regime and the free-molecular regime.
Figure 3. Relative error of for the LNMOM and the ELNMOM for different initial cases in the continuum regime.
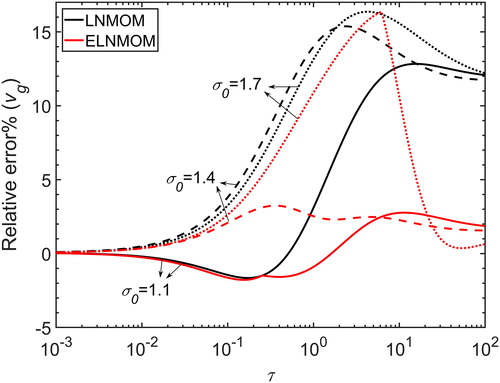
Figure 4. Variations of with time for different initial
predicted by the LNMOM, the ELNMOM and the SM in the continuum regime.
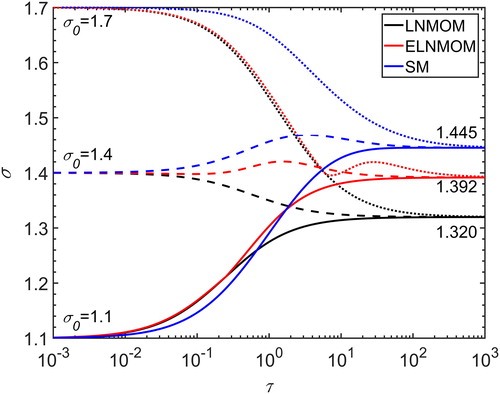
Figure 5. Time evolution of the particle size distribution predicted by the LNMOM, the ELNMOM and the SM for =1.4 in the continuum regime.
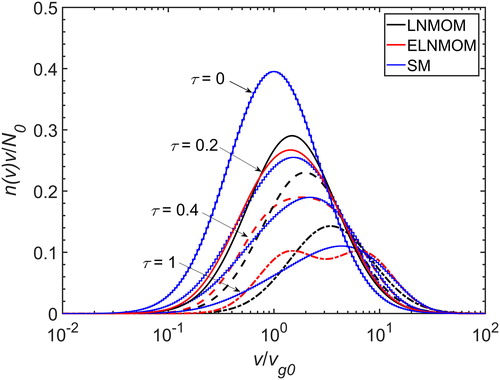
Figure 6. Relative error of for the LNMOM, the ELNMOM and the TEMOM for different initial cases in the free-molecular regime: (a)
=1.1; (b)
=1.4; (c)
=1.7.
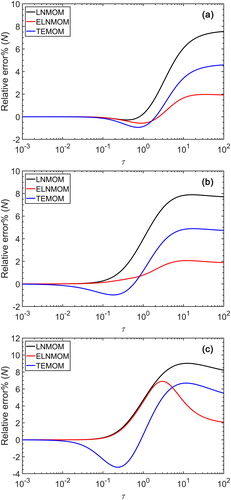
Figure 7. Relative error of for the LNMOM and the ELNMOM for different initial cases in the free-molecular regime.
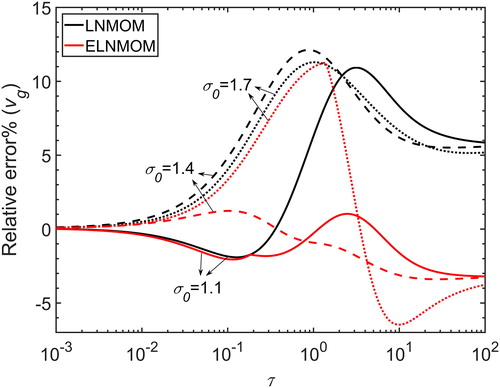
Figure 8. Variations of with time for different initial
predicted by the LNMOM, the ELNMOM and the SM in the free-molecular regime.
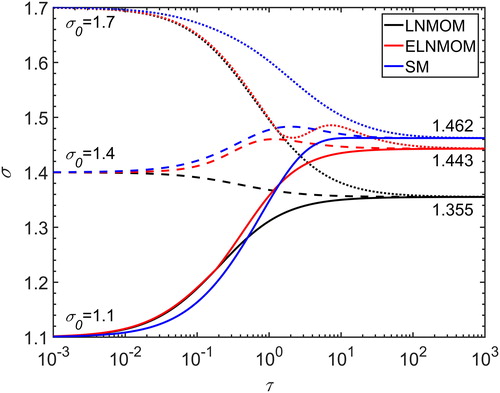
Figure 9. Time evolution of the particle size distribution predicted by the LNMOM, the ELNMOM and the SM for =1.4 in the free-molecular regime.
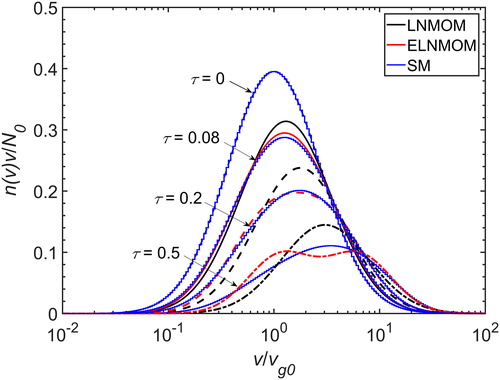
Table 4. Computation time for the LNMOM, the ELNMOM and the TEMOM for =1.4 in the continuum regime and the free-molecular regime.