Figures & data
Figure 1. Representation of the experimental setup displaying the bus accelerating passed the inlets to the instruments (three times) to which gas phase and particle measurements are made. The middle panel displays these three passages of the bus as observed in elevated CO2 and NO2 concentrations. The top panels display the subsequent CIMS desorption profile for sulfuric acid (top right) and the corresponding high resolution peak fitting (top left).
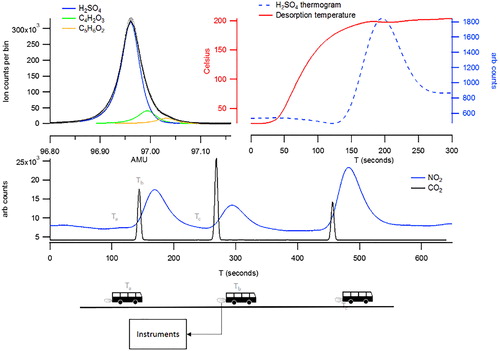
Table 1. Summary of top 20 EFFRESH and EFAGED of PM contributing species in RMEHEV, CNG, and diesel emissions. EFTOTAL (in mg kg−1) and EFCIMS observed are also calculated.
Figure 2. Average mass spectra for a bus desorption file focusing on the theoretical deprotonated mass for stearic acid (C18H36O2). Plot A shows the theoretical mass peak at m/z = 283.26 and calibrated signal peak significant shifted to lower m/z (peak to the left) obtained by using standard mass calibrants. Plot B is the same plot but using PFPA as a mass calibrant and there is a perfect fit between theoretical and calibrated positions.
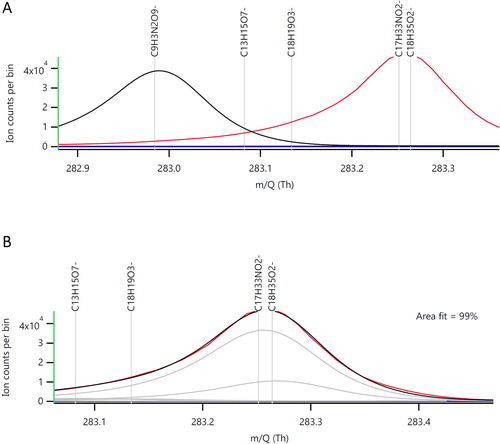
Figure 3. Illustrating of the CIMS results from measuring lubrication oil after being nebulized and passed through the Go:PAM reactor. The bottom panel shows the average Go:PAM background MS during desorption with no addition of lubrication oil and the top panel represents the % increase of signal for each mass during calibration. The top right table illustrates the species which increased the most relative to the background.
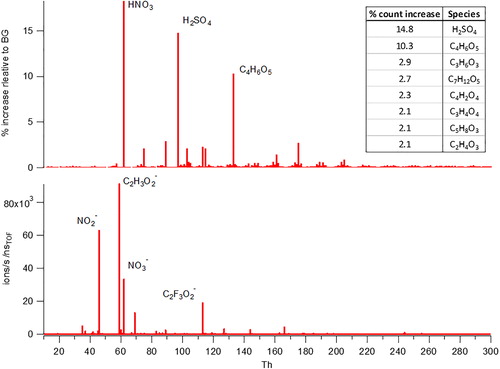
Figure 4. Peak fitting for lactic acid sulfate (LAS) (C3H5SO6) and its subsequent desorption profile displayed with H2SO4 standard and nonstandard (with double desorption) profiles and urea sulfate ion. The C10H18O4 desorption profile is displayed as a guideline for what a “standard” desorption by the FIGAERO produces.
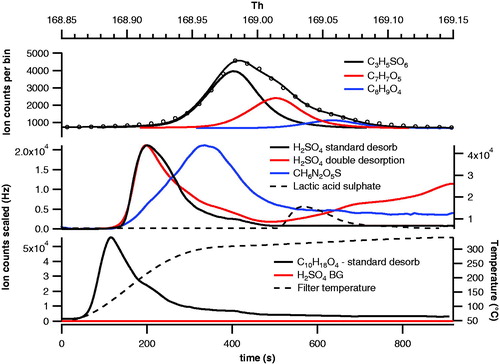
Figure 5. Urea oxidation products and further byproducts of isocyanic acid and salt formation. Spectral fits for key species are highlighted to illustrate the accuracy of identification.
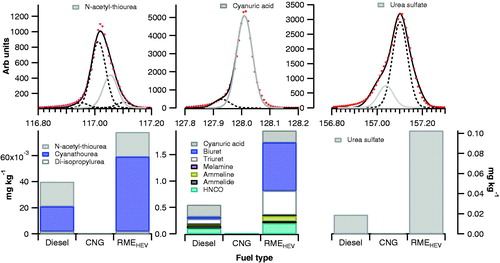
Figure 6. Contribution of FAs to the EFFRESH and EFAGED for RMEHEV buses. The top right panel illustrates the factor change of EF between EFFRESH and EFAGED as a function of O:C ratio of the FAs.
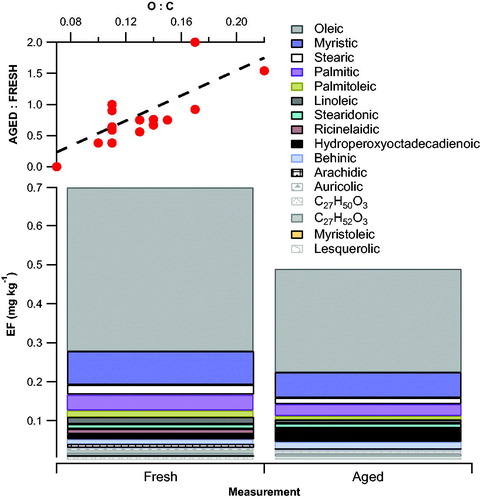
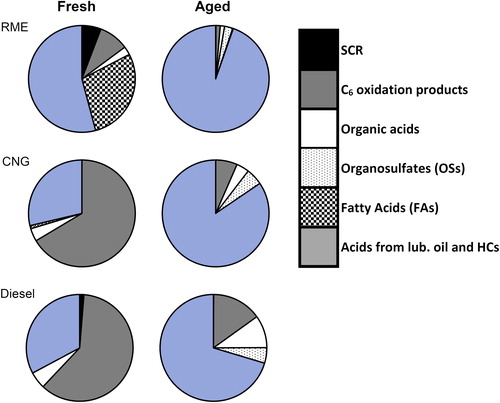
Figure 7. Mass composition measured by CIMS for the fuel types in fresh and aged emissions sorted into six source types: SCR technology, C6 oxidation products, OSs, FAs, and acids which may come from multiple sources (FRESH – oxidation of lubrication oil during combustion and AGED – oxidation of lubrication oil, oxidation of fuel combustion species. Here the inorganic acids H2SO4 and HNO3 were omitted.