
Figures & data
Figure 1. A sketch of the wind tunnel experimental setup. Illustration of the experimental setup showing the vegetated section inside the wind tunnel, the particle generation inside the mixing chamber and the location of the meshes to homogenize the inflow velocity. The neutralizer and the SMPS unit used to measure concentrations are also shown. The air flow direction is from left to right.
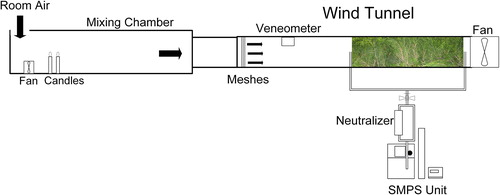
Figure 2. Left panel is a single juniper branch. Right panel is a picture illustration of the juniper branches positioned in the wind tunnel.
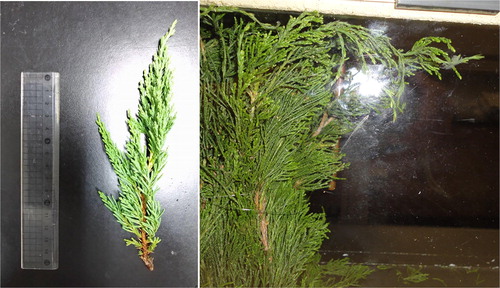
Table 1. Percentage of the singly, doubly, and triply charged particle at different sizes (25, 50, 75, and 100 nm) from TDMA results.
Figure 3. Penetration values as a function of UFP diameter with (blue) and without (red) the neutralizer in the wind tunnel for different mean wind speeds Uo.
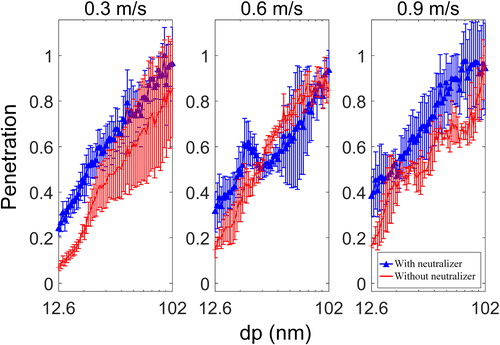
Figure 4. The comparison between measured and fitted penetration values for zero charged (top row) and singly charged (bottom row) particles as a function of UFP diameter.
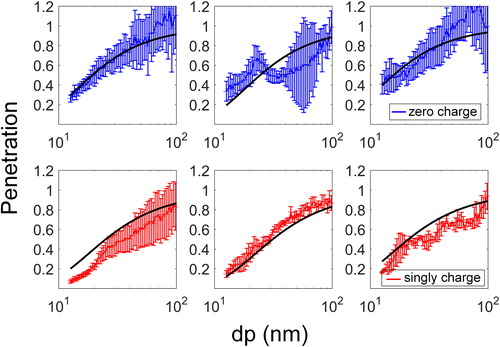
Figure 5. The coefficient as a function of KIM for different studies. Note the increase in
with declining KIM.
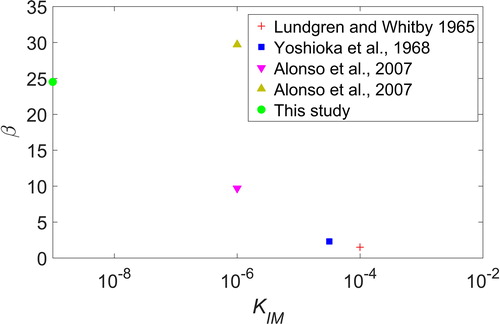
Figure 6. The relation between single fiber efficiency of image force (EIM) and the dimensionless number (KIM) for the 3 wind speed conditions.
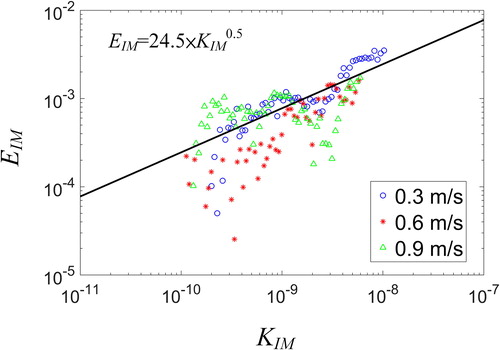
Table 2. Comparison of the image force in single fiber theory from different studies.
Figure 7. Scatter plot of the modeled and measured penetration for zero and singly charged particles. The solid line is the 1:1 relation and the dotted line is 20% deviance from the solid line.
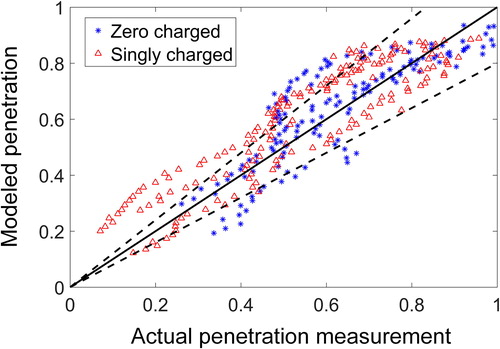
Table 3. The goodness of fit values (R2 and RMSPE) between model and measurements for zero charged and singly charged particles.