Figures & data
Figure 1. Schematic of the experimental set-up. Cement powder was deposited in the glass funnel and the dry air suspends the particles in the air and moves the fine particle fraction to the mixing and measurement chambers. The analytical instruments used are listed on the right.
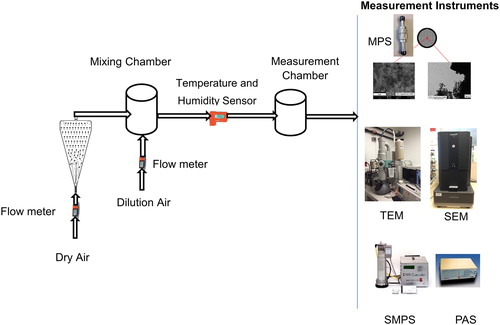
Figure 2. Particle number size distribution for photocatalytic and regular cement the size distribution information obtained by SMPS and PAS. SMPS measure the nanoparticles size range from 11 to 1,083 nm, while PAS measure fine particle from 250 to 32,000 nm.
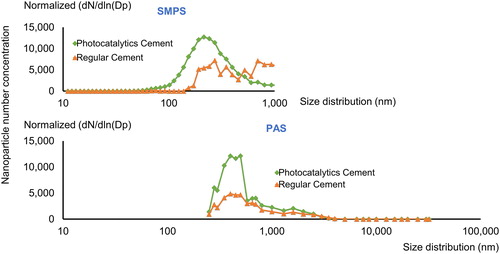
Table 1. Particle number and mass concentration measured for photocatalytic and regular cement from triplicate experiments.
Figure 3. Mass-size distribution of photocatalytic cement and regular cement measured with PAS.
Figure 4. Elemental composition analysis (SEM-EDX) given in percent for each substance contained in regular and photocatalytic cements, both in powder and aerosol forms.
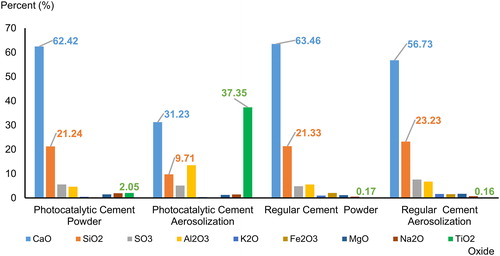
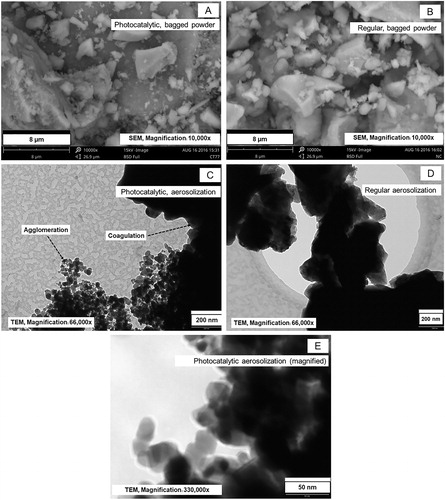
Figure 5. Schematic of SEM and TEM images of photocatalytic and regular cement.