Figures & data
Figure 1. Particle size distributions by number and by volume obtained from the SMPS, infectious MS2 size distribution obtained through plaque assay, and total MS2 size distribution obtained from RT-qPCR, for three aerosolized suspension media: (a) DI water, (b) BES, and (c) AS. All the data points measured with SMPS were repeated four times. Data points of DI water for both infectious and total MS2 were triplicates, while for BES and AS, data points were repeated twice. Standard deviations were calculated and shown in the figures as error bars.
Figure 2. Infectious and total MS2 per particle generated in different suspension media as a function of aerosol particle size: (a) DI water, (b) BES, and (c) AS.
Figure 3. Survivability of MS2 as a function of particle diameter for different nebulization suspensions. Note: DI excluded and AS excluded are the data points that were not taken into analysis in the “Virus and genomic RNA equivalent per particle as a function of particle diameter and nebulization suspension” section. Data points of DI water for both infectious and total MS2 were triplicates, while for BES and AS, data points were repeated twice. Standard deviations were calculated and shown in the figures as error bars.
Figure 4. Conceptual illustration of various distribution patterns of virions inside aerosolized particles with respect to power law factor of (a) 1, (b) 2, (c) 3, and (d) >3 (cross-sectional view of the particles). Three particle sizes are presented (evolving from the smaller to larger), and the smallest spheres represent virions.
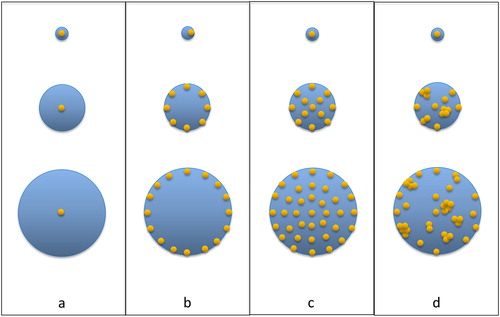
Figure 5. Calculated and measured values of PFU carried per particle. Data points of DI water for both infectious and total MS2 were triplicates, while for BES and AS, data points were repeated twice. Standard deviations were calculated and shown in the figures as error bars.