Figures & data
Table 1. Characteristics of required three-stage lens system as determined by the Aerodynamic Lens Calculator (Wang and McMurry Citation2006) for different gas (argon) mass flow rates.
Figure 1. Size-dependent contraction factor for single focusing orifices (dashed lines) and the full aerodynamic lens (bold line) as function of particle diameter as predicted by the Aerodynamic Lens Calculator (Wang and McMurry Citation2006).
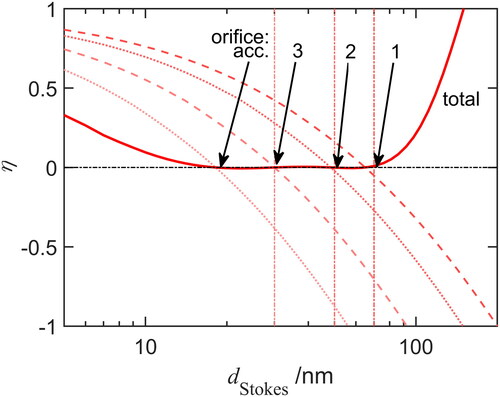
Table 2. Proposed and chosen single lens design according to Aerodynamic Lens Calculator (Wang and McMurry Citation2006): orifice diameter as well as mass flow rate for different carrier gases and focused Stokes diameter ( = 5,200 kg/m3).
Figure 2. The three-stage aerodynamic lens system.
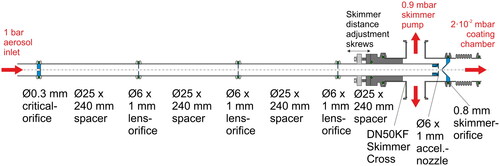
Figure 3. Axisymmetric CFD simulation of the lens system. Display is radially stretched by a factor of 5. (a) Velocity magnitude (top part) and pressure (lower part) of the gas and (b) particle trajectories, shown without (top part) and with added Brownian motion (bottom part) for different particle diameters.
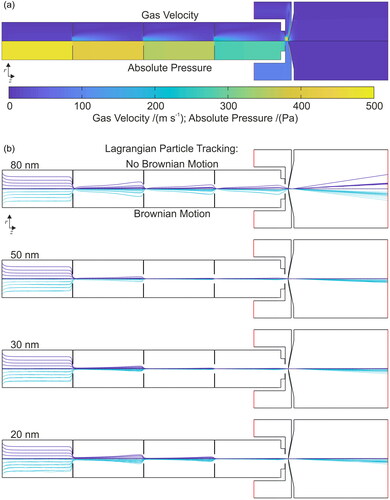
Figure 4. Simulated transfer efficiency of the lens assembly as function of the Stokes diameter of the particles coming from two different synthesis conditions indicated in the legend.
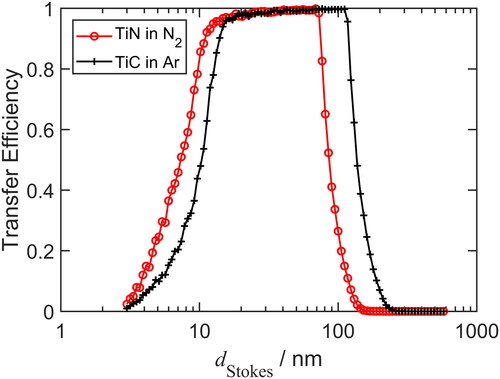
Figure 5. Setup for assessment of single lens behavior and optimization of distances.
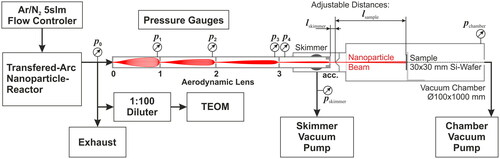
Figure 6. Experimental arrangement for incorporating nanoparticles from an atmospheric-pressure arc discharge reactor through an eightfold aerodynamic lens array onto a stack of rings inside a PVD coating chamber operated at 2 Pa.
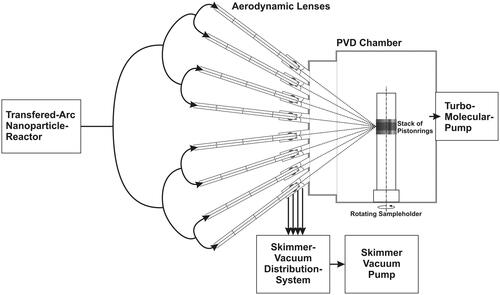
Table 3. Comparison of design parameters using the Aerodynamic Lens Calculator with CFD simulation and experimental build setup using the pressure as comparison value.
Figure 7. (a) Fluent simulation of acceleration nozzle without skimmer indicates Mach number and position of Mach disk as well as particle beam width of 30 nm TiN particles. Skimmer positions are indicated. (b) Measured collection efficiency for different nozzle to skimmer distances. Best efficiency is reached in second zone of silence with narrower particle beam width.
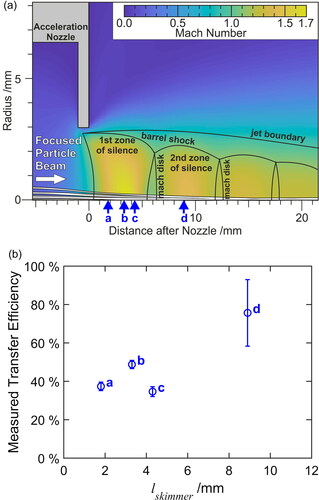
Figure 8. Measured collection efficiency for different gas compositions using a skimmer distance of 8.9 mm. The effect of the gas composition is negligible for the transfer system.
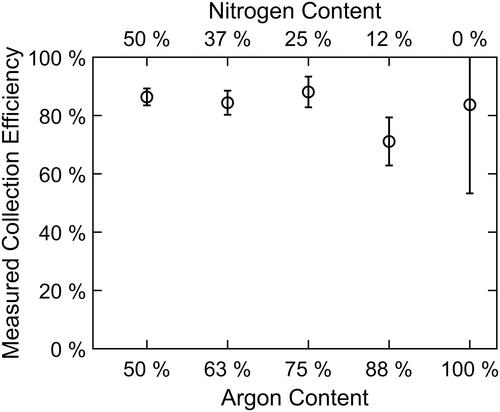
Figure 9. Profile of the deposited particles measured in different locations after the skimmer.
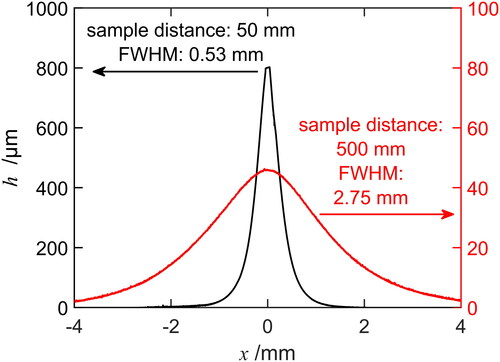
Figure 10. SEM images of cross-section of thin CrON films: (a) without nanoparticles and (b) with embedded nanoparticles (synthesis conditions: 50% argon in nitrogen, = 20%vol).
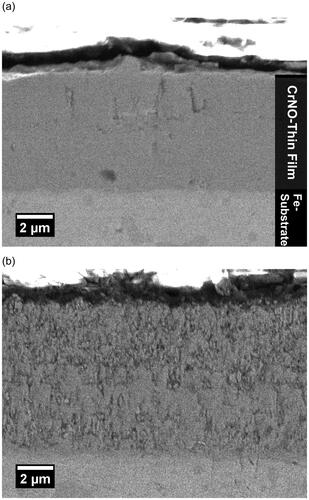
Figure 11. (a) STEM image of thinned cross section of CrON thin film without particles, (b) TEM image of TiCN nanoparticle agglomerates used for deposition, (c) STEM image of thinned cross section of CrON thin film with embedded TiCN particles, and (d) dark-field STEM with inset EDX elemental maps for Cr and Ti of the marked area (TiCN synthesis conditions: 50% nitrogen in argon, = 20%vol).
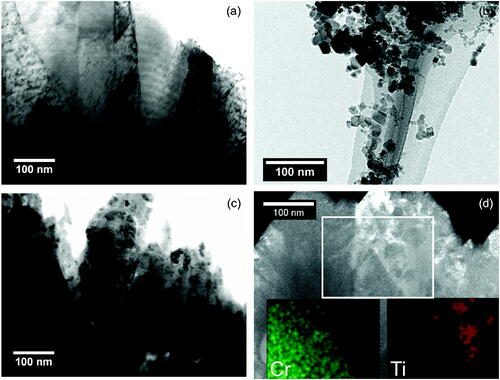
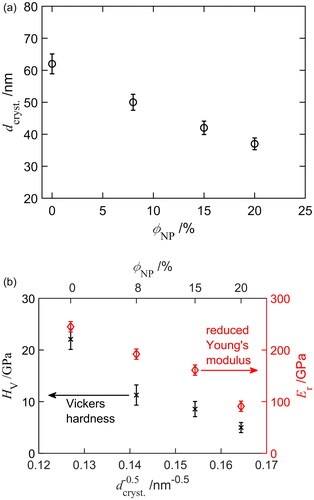
Figure 12. (a) Crystallite size of the CrON matrix material as measured by XRD as function of nanoparticle content
and (b) mechanical film properties in form of Vickers hardness
and reduced Young’s modulus
as function of crystallite size and nanoparticle content.