
Figures & data
Figure 1. Schematic of calibration system using mass to charge ratio for classifying the aerosol.
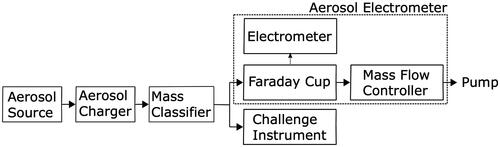
Figure 2. Schematic for aerosol electrometer testing.
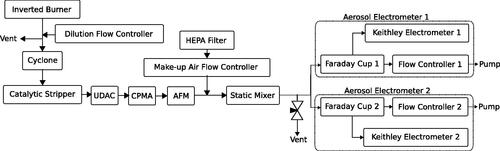
Figure 3. Schematic of tandem CPMA experiment.
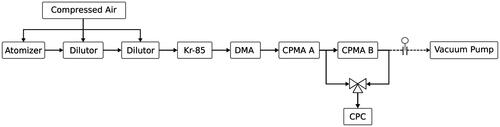
Figure 4. Example data set and fitting output. Set point of 10 fg with a resolution of 0.33 and flow rate of 1.5 LPM. The solid line represents the convolution with the optimized fitting parameters accounting for non-idealities of the CPMA transfer functions. The dashed line represents the ideal theoretical convolution (i.e., λ = μ = ψ = 1).
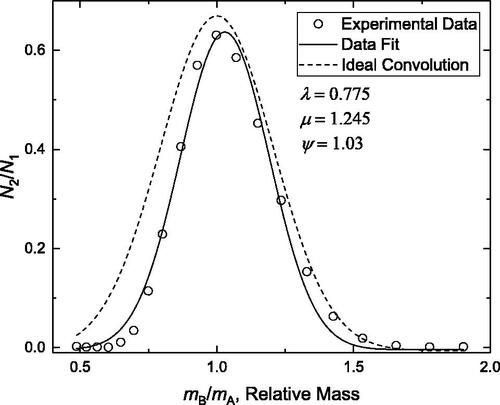
Figure 5. Repeatability, intermediate precision, and instrumental bias measurements for two flow controllers. Error bars represent the standard deviation (repeatability) for each test. Each daily average consists of 10 individual measurements.
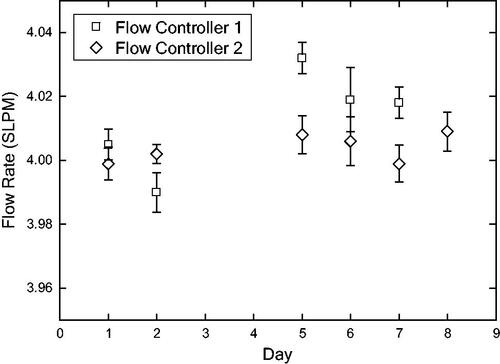
Figure 6. Calibration of electrometers against a reference method.
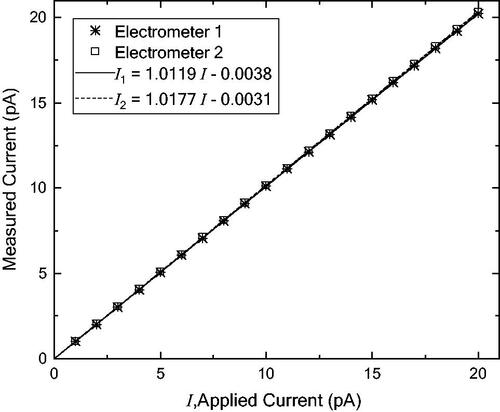
Figure 7. Comparison of aerosol electrometer measurements over several days of measurements.
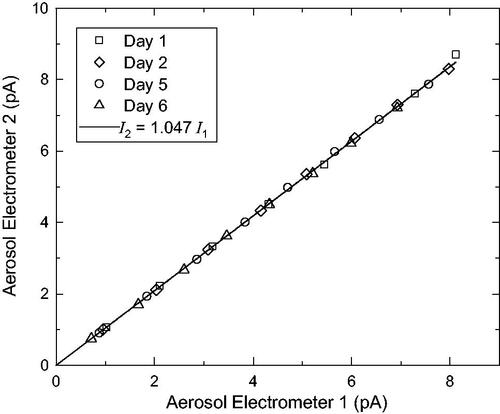
Figure 8. Mass offset measurement for the transfer function of the two CPMA's. Measurements were made with each respective CPMA in position B as identified by . The error bars on the plots represents the uncertainty in the mean of the measurements with 95% confidence.
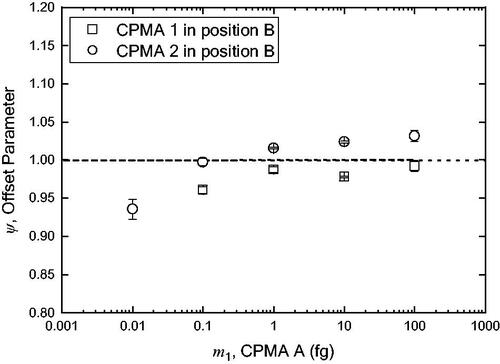
Figure 9. Repeatability of the CPMAs while in position B in the tandem CPMA-CPMA experiment. Each point represents the repeatability (standard deviation) of six consecutive measurements.
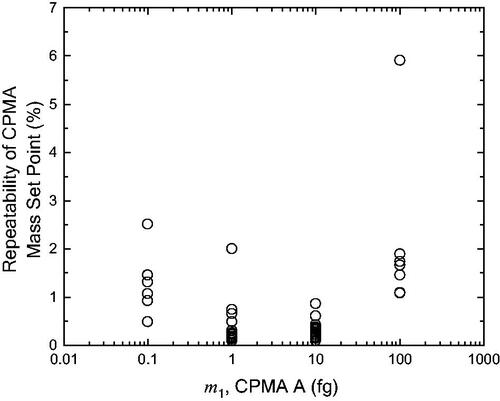
Table 1. Summary of instrumental bias, repeatability, and intermediate precision of elements in the mass calibration system.