Figures & data
Figure 1. Changes in (a) aerosol composition, (b) effective imaginary refractive index, and (c) AAE as a function of ozone exposure. At increased exposures, the aerosol is observed to become more oxidized and less absorbing. Atmospheric age is calculated assuming an ozone mixing ratio of 40 ppbv and is shown on the top axis. The error bars represent the standard deviation of the measurement during each oxidation step. Only one retrieval of k was made for each oxidation step and thus no error bars are reported for k405 and k532. Precision-based error bars, using an estimated precision of ∼0.0001, would be smaller than the symbols.
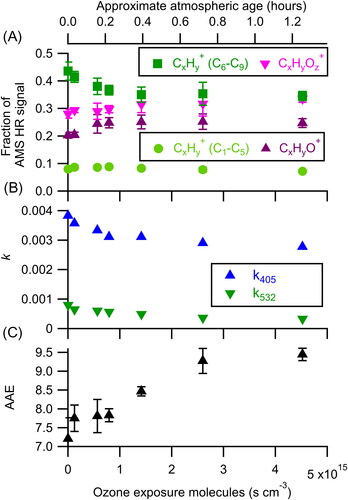
Figure 2. Fraction of the original signal remaining as a function of ozone exposure. The fastest decaying CxHy+ ions refer to the three most rapidly decaying high-resolution ions (C5H6+, C7H9+, and C8H9+). While k405 decays at a rate similar to the C6–C9 CxHy+ ions, k532 decays more quickly approaching the rate of the most rapidly decaying ions. Atmospheric age is calculated assuming an ozone mixing ratio of 40 ppbv and is shown on the top axis.
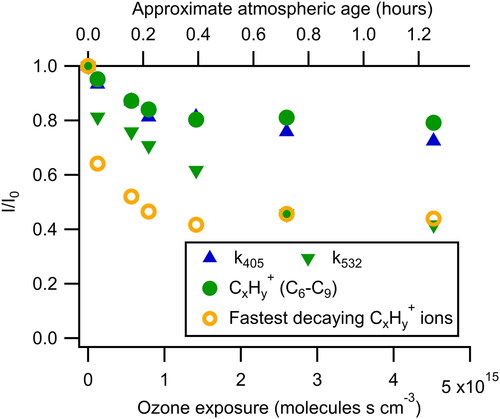
Figure 3. Changes in (a) aerosol composition, (b) effective imaginary refractive index, and (c) AAE as a function of OH + ozone exposure. The solid lines represent an exponential fit used to determine the effective second order rate constants for C6–C9 CxHy+ (7.4 × 10⁻¹³±0.7 × 10⁻¹³ cm3 molecules−1 s−1) and k405 (9 × 10⁻¹³±2 × 10⁻¹³ cm3 molecules−1 s−1). The error bars represent the standard deviation of the measurement during each oxidation step. Atmospheric age is calculated assuming an OH concentration of 1.5 × 10⁶ molecules cm−3.
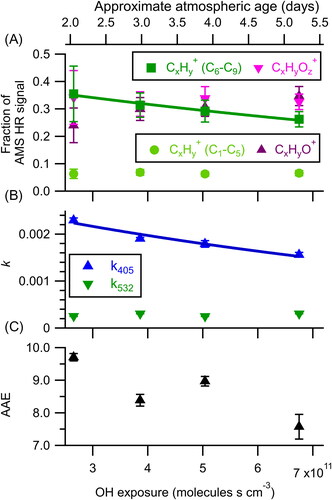
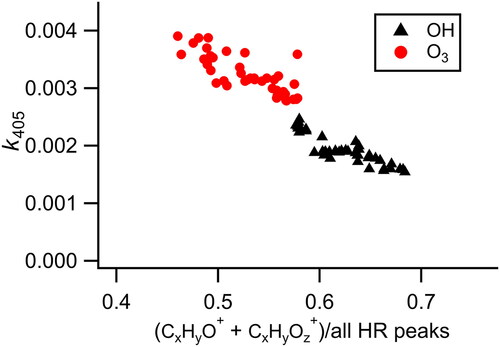
Figure 4. Relationship between k405 and the aerosol oxygen content during heterogeneous oxidation by ozone and OH + ozone showing a connection between increasing oxygen content of the aerosol and decreased absorption. For completeness, measurements during transitions between oxidant levels (which are not used in the kinetics analysis, ) in the flow tube are included here.