Figures & data
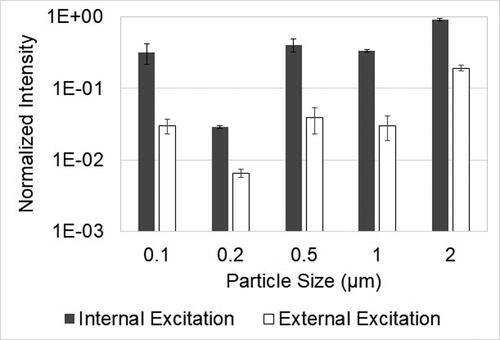
Figure 1. Capillary collector design: The needle ring assembly is called the ionization region and wire tube assembly is called the collection region (top). Particles entering the device are charged due to the corona discharge in the ionization region and are repelled by the electric field in the collection region leading to the collection of particles on the capillary surface (bottom).
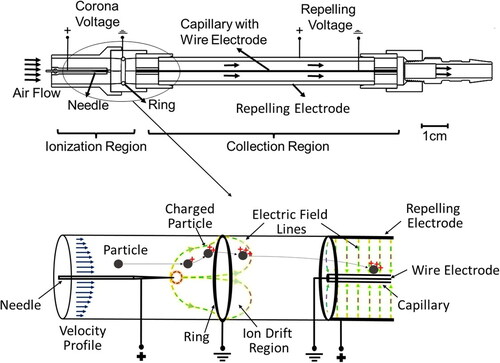
Figure 2. Schematic diagram of the experimental setup used to optimize φC and φR for maximum capillary collection efficiency. The particle concentration leaving the device was measured by the APS, and the CE of the device was calculated.
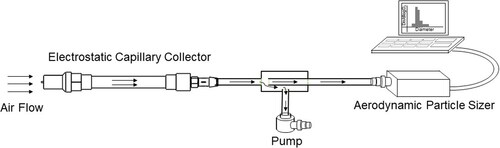
Figure 3. (a) Fluorescent PSL particles in the PM2.5 size range were sampled using the capillary collector and a reference filter in an aerosol chamber. The capillary collection was determined by measuring the bulk fluorescence signal of particles collected on the capillary and filter. (b) Typical size distribution of PSL particles during the collection, recorded by the APS.
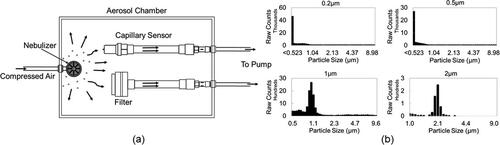
Figure 4. Fluorescence spectra of PSL particles collected on capillary were recorded using internal excitation and external excitation as shown in the schematic.
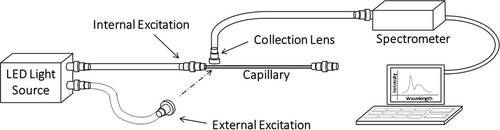
Figure 5. (a) The TC of the capillary sensor for PM2.5 increases with increasing corona voltage (φC). (b) The CC of the capillary sensor for PM2.5 is maximum at corona voltage (φC) = 4 kV and repelling voltage (φR) = 2 kV.
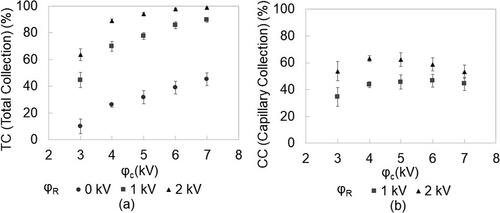
Figure 6. Comparison of PM2.5 collection on the capillary obtained by two methods: (i) bulk fluorescent measurements of PSL particles (FCC), and (ii) particle concentration measurement of ambient air (CC).
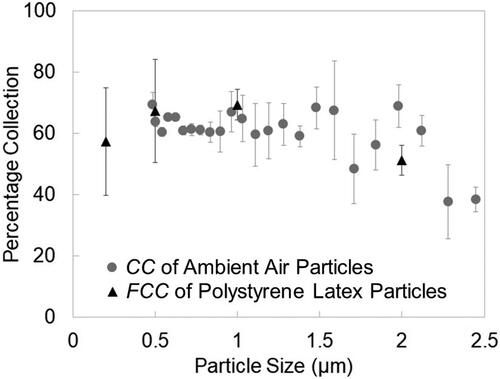
Figure 7. The normalized maximum fluorescence intensity for the internal excitation method is greater than the external excitation method; plotted with standard error (n = 3).