Figures & data
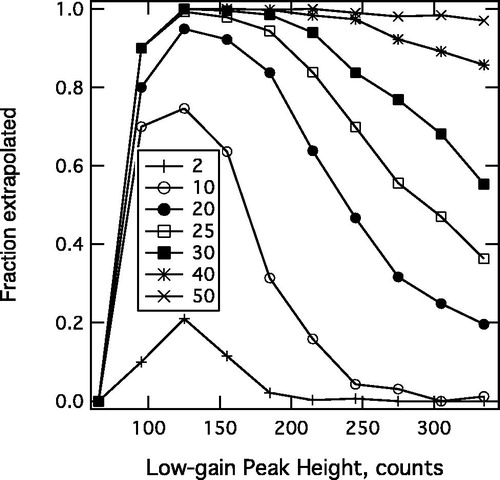
Figure 1. Time-resolved thermal radiation signal from three different rBC-containing particles of different masses. The plot shows the similarity in signal shape; this shape is approximately seen for all rBC-fractions, with the rare exceptions noted in the text. Note that changes in laser intensity, particle speed through the laser, and measurement pressure can all perturb these signals.
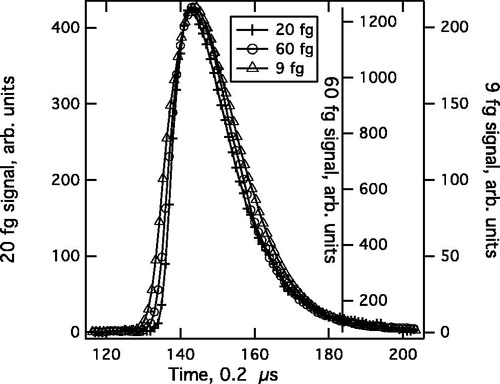
Figure 2. Simple extrapolation of the incandescent signal (black solid line, with saturated data removed). The forward linear extrapolation of the leading edge of data is shown with open circles, while the lagging linear extrapolation is demarked with crosses.
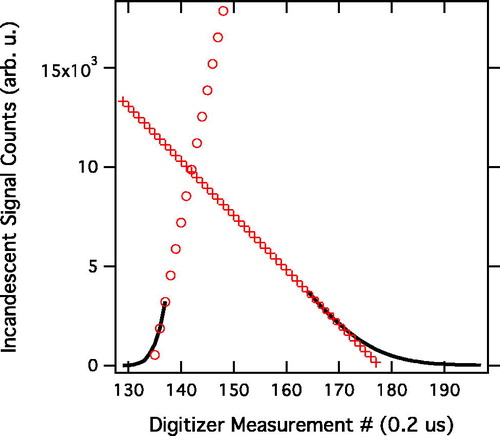
Figure 3. Scatter-plots of extrapolated to actual peak height for detection events. Dashed black lines indicate perfect extrapolation (i.e., the gain relationship between the detectors used for the vertical and horizontal axes). Left: the case of synthetically saturated data. Right: The large-particle case. The color scale indicates the number of 0.2 µs data points that were saturated for each detection point. Unsaturated detections are indicated by black markers.
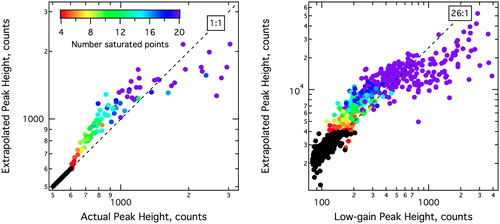
Figure 4. A detection event showing a shoulder likely due to penetration into a lower intensity regime of the laser. Shown are extrapolations for two different cases of saturation. A modest saturation showing a high bias, and a more extreme saturation associated with low bias.
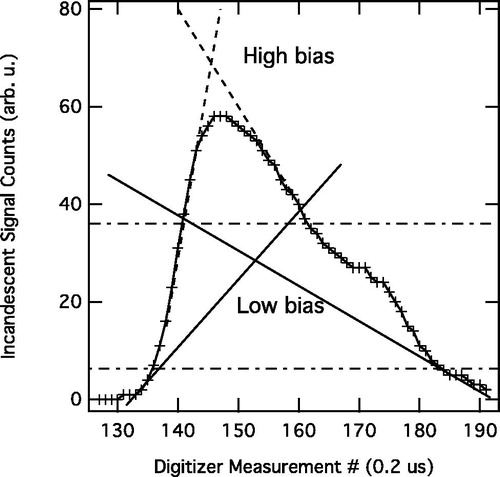
Figure 5. Extrapolated amplitudes under different SP2 operational setups. Solid markers are associated with higher particle speed through the laser while lined-markers are associated with slow speed. Red triangle and asterisks are at low laser power, green diamond and cross at medium laser power, and blue circles and hash-mark for high laser power. Duplicate measurements to assess variability are shown with the same markers. Error bars represent statistical error on the mean in each bin. The gray box delineates the data points presented in .
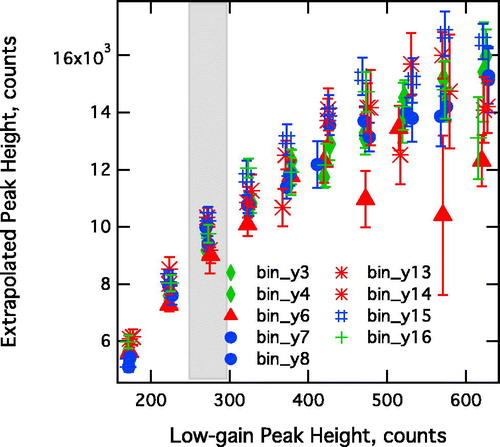
Table 1. Extrapolation averages observed for different SP2 operational set-ups.
Figure 6. Errors associated with the bi-linear extrapolation. On the left, (a) and (c), errors are binned and plotted against peak height determined from the low-gain channel. On the right, (b) and (d), the plots show particle-by-particles errors plotted against the number of saturated measurement points corresponding to each detection (5 MHz data). The upper plots, (a) and (b), show relative error. Whiskers on (b) show the number fraction of particles with more than 50% relative error against a low-gain channel. (d) The range of random error extracted as a function of the number of saturated points.
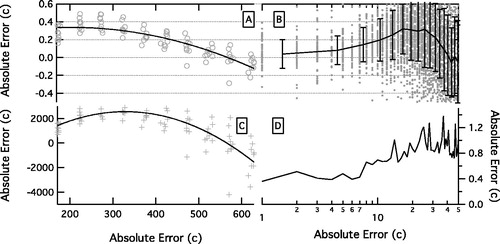
Figure 7. The fraction of extrapolated particles for different choices of the limit on saturated signal duration, resolved by low-gain peak height as a proxy for particle size. The values in the legend indicate the maximal number of saturated points allowed in the extrapolation for 5 MHz digitization.