Figures & data
Figure 1. Potential vaporization mechanisms in TDAMSs. (a) Vaporization of an airborne particle induced by an internal energy source. (b) Vaporization of a particle via impaction onto a heated surface. Vaporization of (c) a single particle and (d) an ensemble of particles, respectively, collected on a surface.
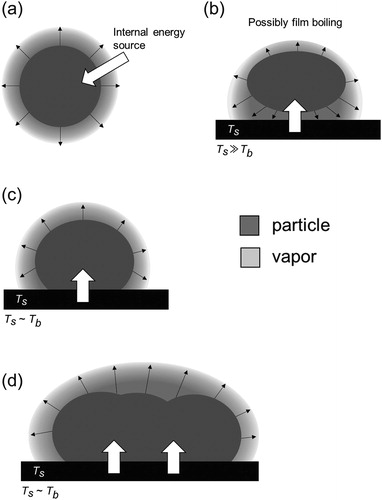
Figure 2. (a) Conceptual structure of the first section (collision domain) of the model. The collision domain is composed of cubic grid cells that are arranged along the x, y, and z axes. The center of the vaporization source is set at the origin of the xyz coordinate system. (b) Conceptual illustration of the collision between the i-th and j-th molecules in a grid cell. The ratio of the relative velocity () to the maximum relative velocity (
) represents the probability of the collision between two selected molecules. The probability of collisions becomes larger as
approaches
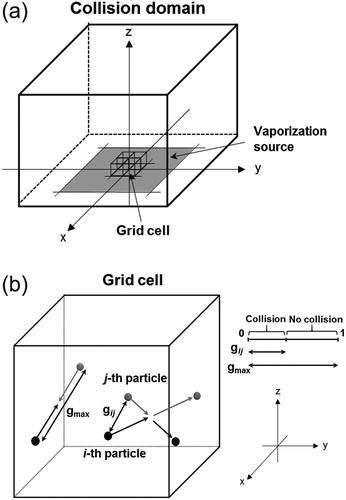
Figure 3. Positions of the ionization regions relative to the origin. The ionization region is represented by a cube with a 5 mm side length that is arranged at positions (i), (ii), (iii), (a), (b), and (c). Positions (i), (ii), and (iii) are located 20 mm from the origin and have polar angles of 0°, 40°, and 80°, respectively. Positions (a), (b), and (c) are arranged to fit the experimental condition in Uchida et al. (Citation2019), and are located at 19, 20, and 23 mm from the origin, respectively, with polar angles of 49°, 63°, and 74°, respectively.
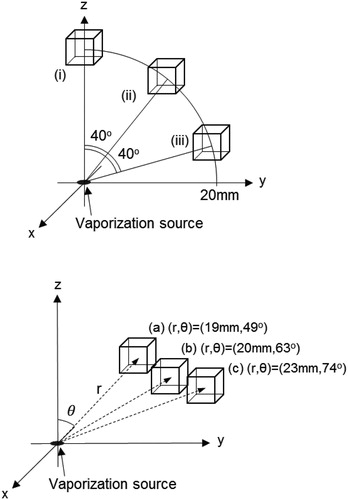
Figure 4. Temporal evolution of the number of molecules evaporating from the vaporization source and staying in the ionization region at positions (i), (ii), and (iii), without molecular collisions. The time step was set to 0.1 μs. The black and gray lines represent the number of NH3 and HI molecules, respectively.
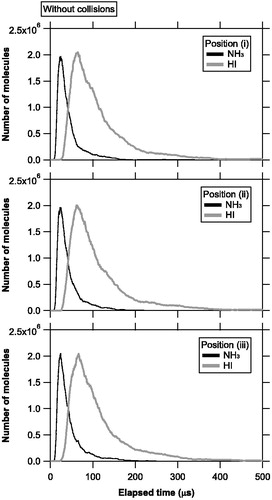
Table 1. QNH3/QHI ratios at each position for the base case simulations.Table Footnotea
Figure 5. Temporal evolution of the number of molecules evaporating from the vaporization source and staying in the ionization region at positions (i), (ii), and (iii), with molecular collisions. The black and gray lines represent the number of NH3 and HI molecules, respectively.
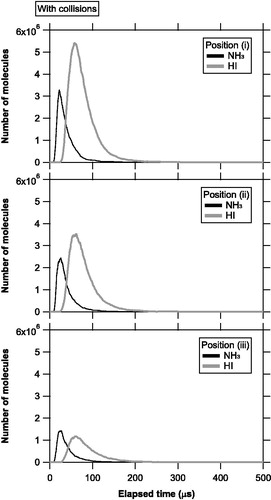
Figure 6. (a) Ratio of the integrated signal for the NH3 molecules to that of the HI molecules (QNH3/QHI) obtained during the laboratory experiments. (b) The QNH3/QHI ratios obtained via the model simulations with and without molecular collisions. We assumed various values for the side length of the vaporization area, L, and vaporization time scale, τ. The solid circles represent the base-case simulations for (L, τ) = (1 μm, 100 ns).
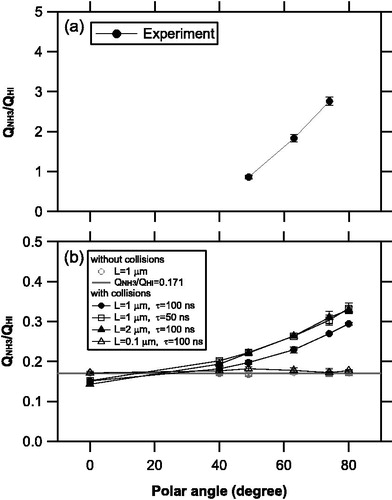
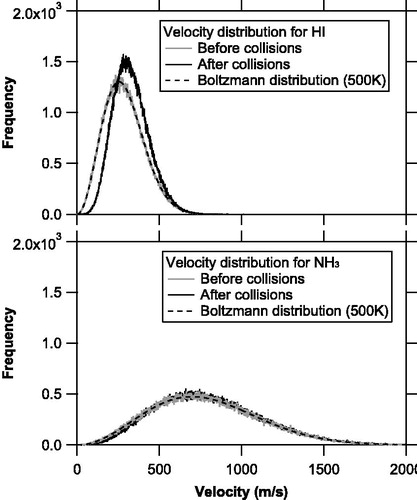
Figure 7. Velocity distributions of the NH3 and HI molecules before (solid gray line) and after (solid black line) molecular collisions for the base case simulations. The Boltzmann distributions at 500 K are also shown as dashed black line.