Figures & data
Figure 1. Cyclic schedule of the batch post-curing ovens.
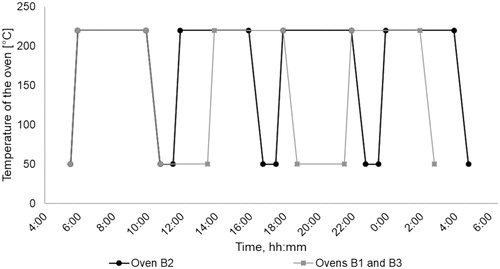
Figure 2. Emission abatement system of the facility studied.
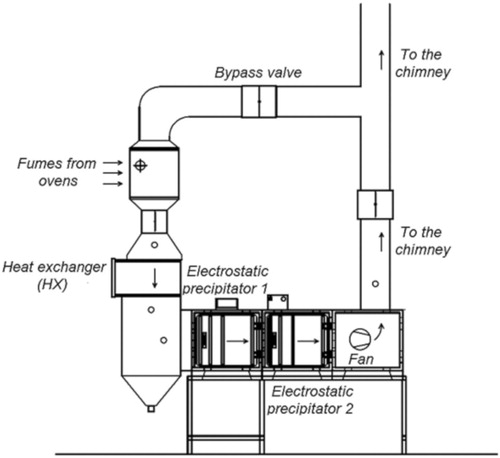
Figure 3. Typical normalized size distribution of the aerosol downstream of post-curing ovens.
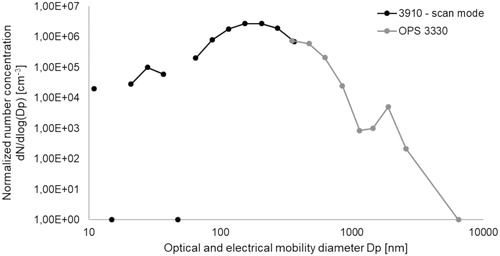
Figure 4. Schedule of the samplings for one single measurement of efficiency.
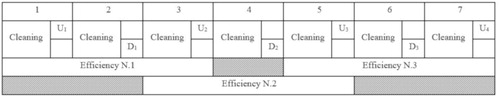
Figure 5. Portable test rig for the validation tests performed using DEHS.
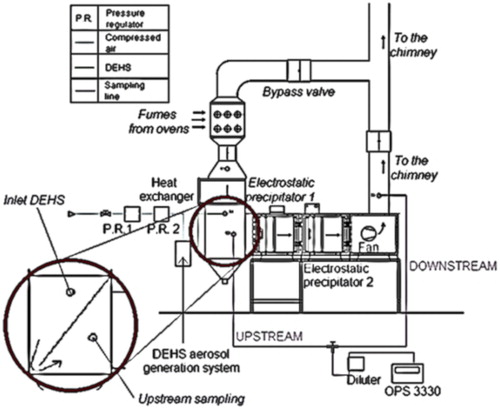
Figure 6. Validation of measurement with OPS 3330 through the comparison of fractional removal efficiency (data not shown up to 10 mm due to few particles).
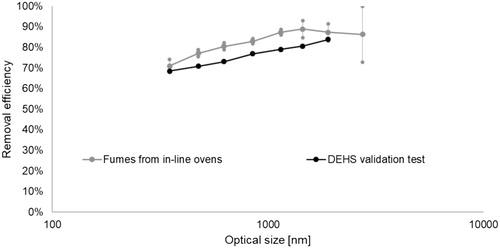
Figure 7. Size distributions of aerosols produced with different test setups.
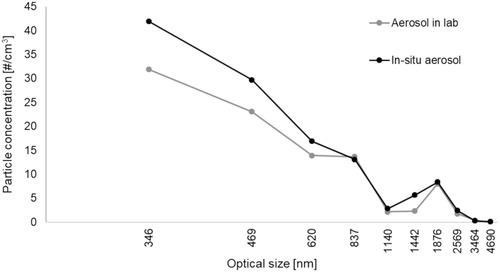
Figure 8. Comparison of fractional removal efficiency measured with different instrumentation and configurations.
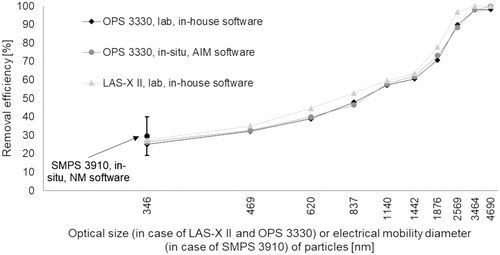
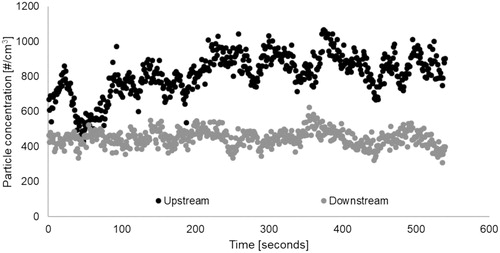
Figure 9. Particle concentration versus time across the ESP downstream of batch ovens measured with SMPS 3910 – 100 nm – No dilution.
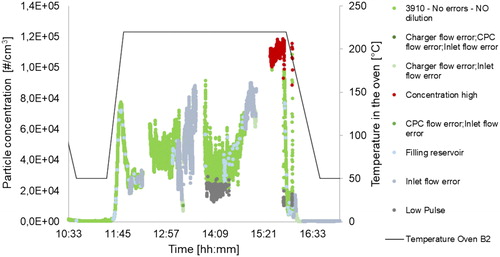
Figure 10. Particle concentration (downstream section of the cooler serving the batch ovens) versus time measured with OPS 3330 – 350 nm – Dilution 1:15 before 11:16, 1:100 afterwards.
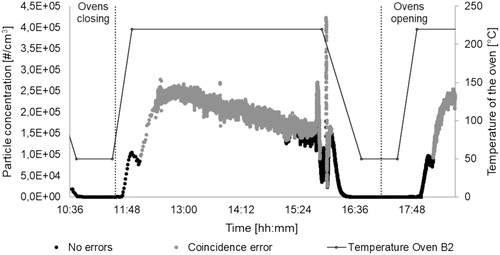
Figure 11. Hourly average particle concentrations downstream of batch ovens versus time. Measured with OPS 3330 – Dilution 1:370 for cooler; for precipitator, 1:200 between 17:39 and 18:37, 1:300 afterwards.
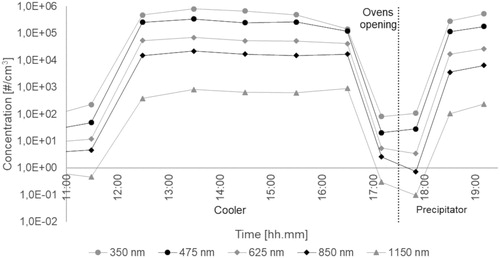
Figure 12. Top view of collection plates with progressive build-up of particles (fumes enter from left side).
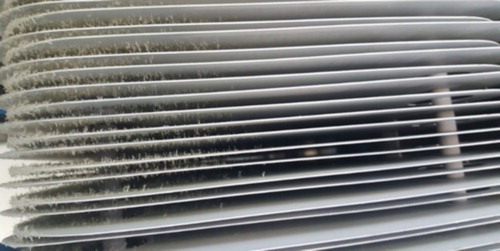
Figure 13. Evolution in time of the fractional removal efficiency of ESPs serving in-line ovens; the number of pieces refers to the number of rubber pieces treated inside the oven since its last maintenance.
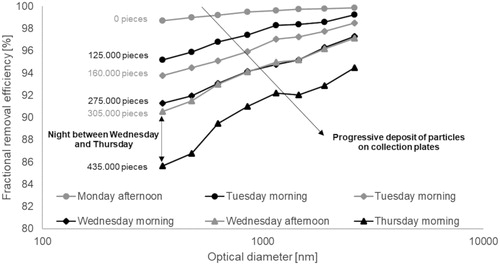
Figure 14. Dependence of the removal efficiency toward 350 nm particles on the amount of post-cured rubber parts.
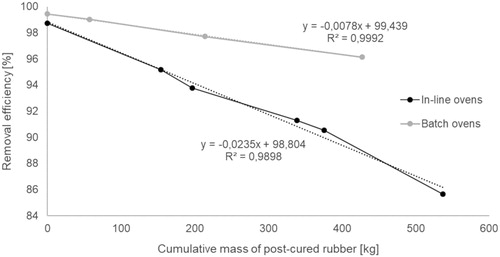
Figure 15. Particle concentration versus time across the ESP downstream of batch ovens measured with SMPS 3910 – 350 nm – No dilution.