Figures & data
Figure 1. The schematic of the three experimental setups utilized during the Missoula Fire Science Laboratory experiments. Acronyms used in this figure: NOx – nitrogen oxide, AMS – aerosol mass spectrometer, CPC – condensation particle counter, SP2 – single particle soot photometer, PAS – photoacoustic spectrometer, SEM – scanning electron microscopy, BrC PILS – brown carbon particle-into-liquid sampler for water-soluble species, DMA – differential mobility analyzer, CPMA – centrifugal particle mass analyzer.
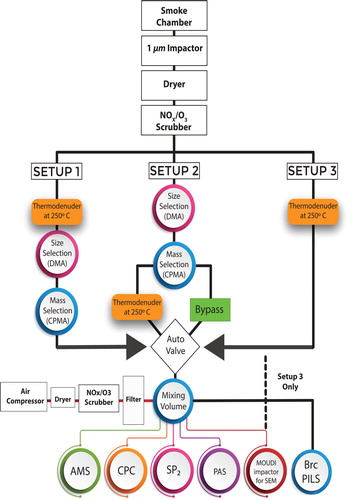
Figure 2. Top panels: SEM micrographs showing particle morphology for two different effective densities (mobility diameters of 200 and 300 nm for a fixed mass of 6 fg). Particle properties were measured after a 250 °C thermodenuder. The combination of a DMA and CPMA produced streams of particle selected by morphology. Lower panel: the fraction of refractory (rBC) total mass measured by the SP2 compared to the selected CPMA mass times the number of particles. The SP2 quantitatively counted the mass and number of chain-aggregate soot particles whereas most of the spherical particles did not produce an incandescence signal in the SP2.
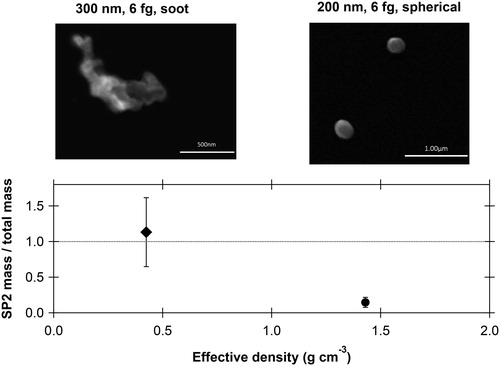
Figure 3. Mass absorption coefficients (MACs) at three wavelengths for the chain-aggregate soot and spherical particles after a 250 °C thermodenuder as shown in . The middle curves and points show that the soot particles produced MACs similar to literature values for black carbon (Bond and Bergstrom Citation2006). The MACCPMA and MACSP2 are similar for the soot particles because the SP2 quantitatively measured their total mass. Per unit mass, the spherical particles (filled circles with lines) absorbed 40–70% of the light compared to black carbon across the entire visible range. The MACs for the spherical particles using the SP2 mass (open circles) are artificially large because most of these particles did not incandesce in the SP2. Nevertheless, the values indicate what would be inferred if the mass of light-absorbing particles were operationally defined from an SP2.
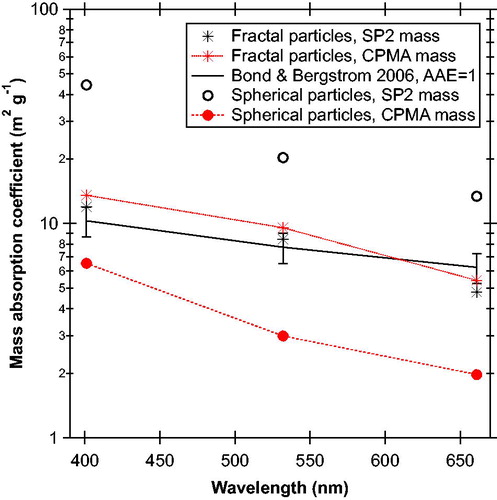
Figure 4. Retrieved MACCPMA values at 401, 532, and 661 nm for thermodenuded biomass burning particles with a range of mobility size and mass selection. For the morphology-selected particles after the 250 °C TD: (A) the MAC normalized by the average total mass (MACCPMA) at 661 nm (marked in red circles) is plotted as a function of the number fraction of rBC particles (measured by the SP2) to the total number of particles (measured by the CPC). The expected calculated MACBC is plotted for comparison (dashed black lines), as we well as the absorption enhancement retrieved by our measurements, for the range MACCPMA 661 nm shown panel B combined with the maximum lensing range retrieved by the SP2 (blue bars). (B) The ratios of the MACCPMA at 401 (marked in blue), 532 (marked in green) to that measured at 661 nm as a function of the number fraction of rBC particles. Dashed and dotted lines show what the ratio would be for various AAE.
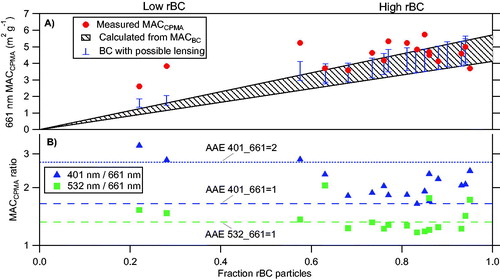
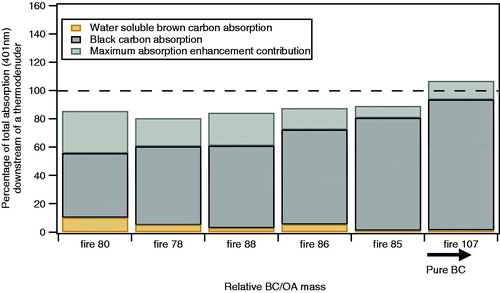
Figure 5. For the fires/fuel types with high BC content, the absorption of the polydisperse population retrieved from BC and water soluble BrC is presented as a function of the fire number ordered by the relative ratio of BC to OA. The dashed line shows the 100% absorption as detected by the PAS at 401 nm. The BC absorption was retrieved using the measured rBC mass and the MACBC found in this study (9.1 ± 1.1 m2 g−1 at 401 nm). The coating enhancement of BC absorption represents the maximum value calculated from the coating thickness retrieved by the SP2. The water-soluble BrC absorption was measured by the BrC PILS.