
Figures & data
Figure 1. TEM images from VDT dispersions of (a,b) MW1, (c,d) MW2, and (e,f) CNF1.
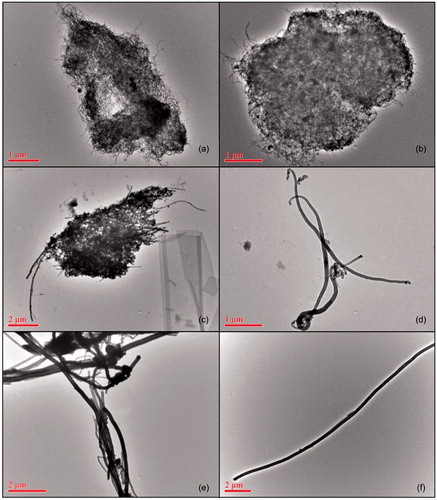
Table 1. Side-by-side sampler configuration comparisons of gravimetric mass collected from material tests at a flow rate of 2 Lpm.
Figure 2. Box and whisker plot (minimum, first quartile, median, third quartile, maximum, and outliers) of the percent errors from the 15 paired samples at 2 and 5 Lpm for each of the four materials at all three configurations. X denotes the reported mean values.
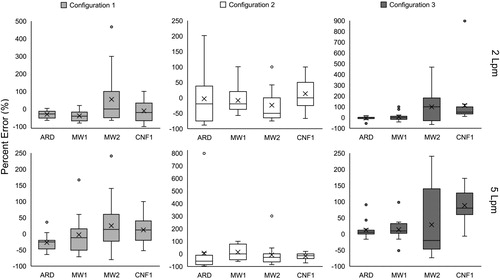
Table 2. Side-by-side sampler configuration comparisons of gravimetric mass collected from material tests at a flow rate of 5 Lpm.
Figure 3. Aerodynamic particle size distribution by number provided by the ELPI and APS for the different test materials: (a) ARD; (b) MW1; (c) MW2; (d) CNF1. The measurements were repeated in triplicate, with the averages being plotted.
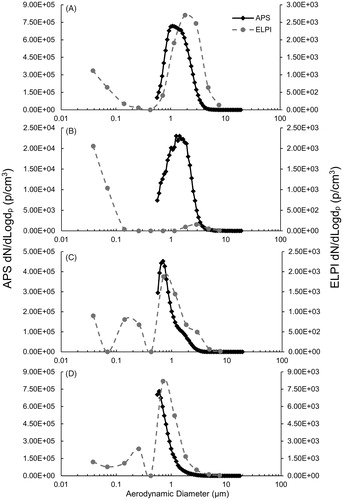
Table 3. Particle aerodynamic diameters of tested materials measured with the APS and ELPI.