Figures & data
Figure 1. Map of sampling location showing Mecklenburg County in south-central North Carolina, major freeways and roads, and the airport relative to the collocation site at the Remount Road sampling station (yellow dot) maintained by the Mecklenburg County Air Quality office. Note that the downtown Charlotte area surrounded by the 77 and 277 freeways is located about 1–2 miles east-northeast of the Remount Road station.
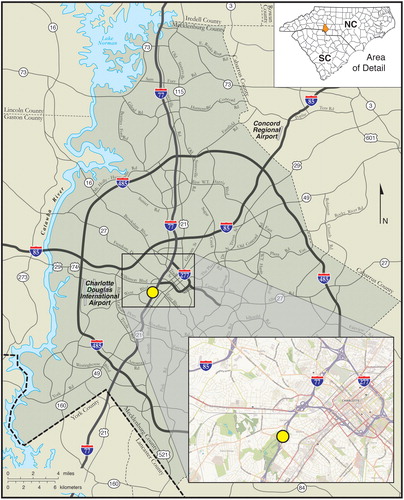
Figure 2. Hourly PM2.5 reported by PA-II versus BAM 1022, where the lower limit of detection (LOD) of applied to the PA-II data and LOD of
for BAM 1022. The data are also limited to raw PA-II PM2.5 less than
due to lack of available data at these high concentrations from the particular sample location. The squares are the average PM2.5 values for RH of 0–40% (dark red), 40–60% (light red), 60–80% (green), 80–100% (blue), showing that the high bias increases as a function of RH. Black line is the one-to-one comparison.
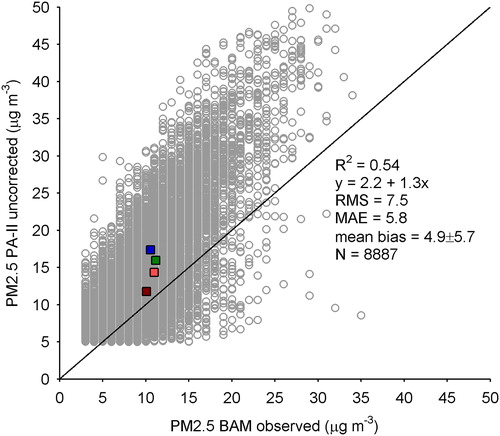
Figure 3. Comparison of hourly uncorrected PA-II PM2.5 versus BAM observed PM2.5 (gray) and corrected PA-II PM2.5 versus BAM observed PM2.5 (purple). Gray and purple lines are the simple linear regression of the gray circles and purple dots, respectively. Statistics included are the RMS and MAE for the uncorrected and corrected (MLR) data, and the number of data points (N) in the regression.
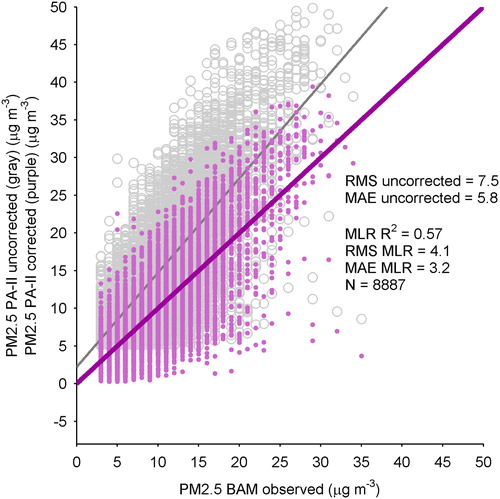
Figure 4. RMS error compared with BAM PM2.5 reference data for uncorrected PA-II (gray triangles), MLR corrected PA-II from this study (blue circles), and linear correction from University of Utah study (red squares). Figures show RMS as a function of (a) ambient RH and (b) ambient T, and then the percent improvement in RMS as a function of (c) ambient RH and (d) ambient T resulting from this study (blue circles) and from the U. Utah correction equation on the Purple Air website (red squares).
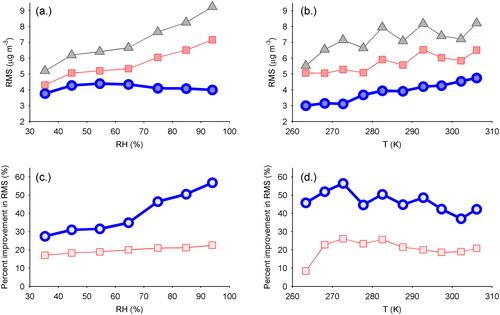
Figure 5. Monthly averaged RMS values calculated relative to reference PM2.5 from BAM using (a) Uncorrected PA-II PM2.5 (gray) and MLR corrected PA-II PM2.5 (dark blue) data, and (b) monthly averaged ambient RH.
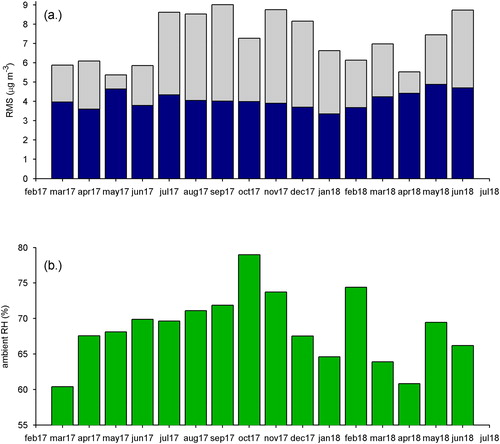
Table 1. The MLR fit coefficients (EquationEquation (1)(1)
(1) ) using different predictors and predictands.
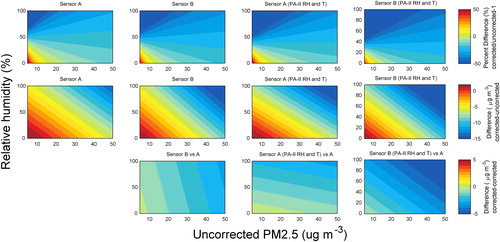
Figure 6. The strength of the MLR correction as a function of relative humidity and the input PM2.5. Columns show different correction equations based on (1) PA-II particle sensor A using weather station RH and T, (2) PA-II particle sensor B using weather station RH and T, (3) PA-II sensor A using PA-II RH and T, and (4) PA-II sensor B using PA-II RH and T. Rows (top to bottom) show the percent difference (%) of corrected PM2.5 from uncorrected, the actual difference (), and the difference of the correction in the column from the correction in column 1 (
).