Figures & data
Figure 1. Comparison of 1-h-average NPM (a) and PurpleAir (b) as-reported sensor readings to the BAM instrument during collocation at the Lawrenceville site. Each point indicates the median across all sensors of the given type present at the site. Shades (colors) indicate RH at the time of the measurements. A breakdown of these results by RH is provided in the online SI (Table S2).
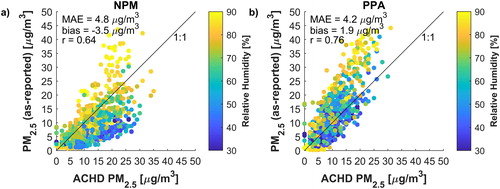
Figure 2. Inter-comparison of as-reported 1-h-average data between sensors during collocation periods at both sites. In the boxplots, circles with dots denote the median, thick bars denote the interquartile range, and thin bars denote the 95% confidence range. Black boxplots indicate metric ranges for pairs of NPM sensors, and gray (purple) boxplots indicate ranges for pairs of PurpleAir sensors. This represents 114 NPM pairs at Lawrenceville, 66 NPM pairs at Lincoln, 16 PurpleAir pairs at Lawrenceville and 1 PurpleAir pair at Lincoln. For reference, the ranges of concentrations measured by BAM instruments at the sites during the same time are depicted in (d).
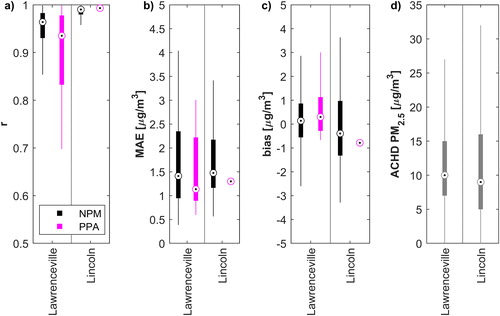
Figure 3. Comparison between medians of as-reported 1-h-average data of 25 NPM and 9 PurpleAir sensors during collocation at the Lawrenceville site. Shades (colors) indicate RH at the time of the measurements.
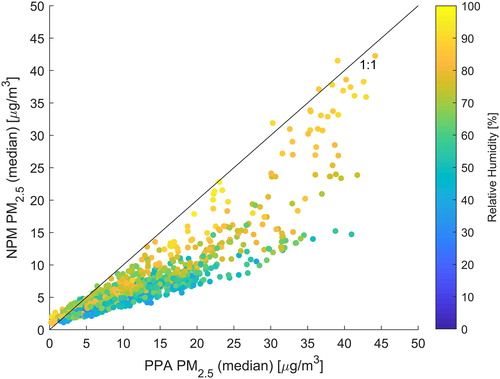
Figure 4. Comparison of 1-h-average NPM (a) and PurpleAir (b) sensor readings to the BAM instrument during collocation at the Lawrenceville site after correction using EquationEquation (3)(3)
(3) , with appropriate coefficients for NPM and PurpleAir. Each point indicates the median across all sensors of the given type present at the site (including both “training” and “testing” sensors). Shades (colors) indicate RH at the time of the measurements. A breakdown of these results by RH is provided in the online SI (Table S3).
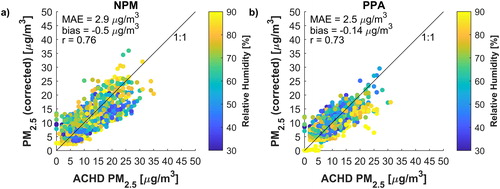
Figure 5. Performance metrics of 1-h-average as-reported and corrected sensor data compared to BAM instruments during collocation at both the Lawrenceville and Lincoln sites. Results shown relate to a total of 17 NPM and 5 PurpleAir sensors of the “testing” set. Corrections are performed using either the approach of EquationEquation (3)(3)
(3) , with appropriate coefficients for NPM or PurpleAir, or the approaches of EquationEquation (4)
(4)
(4) for NPM and EquationEquation (5)
(5)
(5) for PurpleAir.
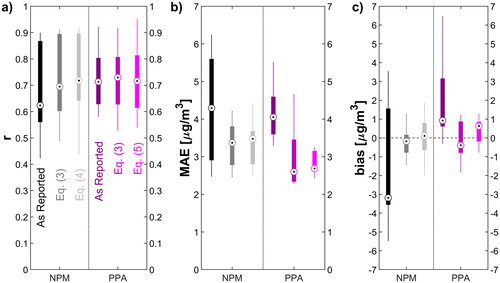
Table 1. Calibrated coefficients for EquationEquation (3)(3)
(3) . Values following “
” represent the standard deviations in the coefficient estimates.
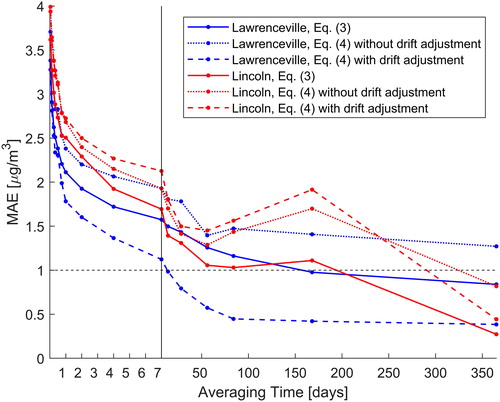
Figure 6. Mean absolute error in PM2.5 measurements for two NPM sensors during long-term deployments as a function of averaging period (note the differing horizontal axis scale on either side of the vertical black line). Solid lines represent measurements corrected using EquationEquation (3)(3)
(3) ; dotted lines indicate measures corrected using EquationEquation (4)
(4)
(4) but not drift-adjusted; dashed lines indicate measures corrected using EquationEquation (4)
(4)
(4) and drift-adjusted using the AL method. Points along the lines indicate which specific averaging times were evaluated.