
Figures & data
Figure 1. (a) Schematic of the PFPC stages, each consisting of a two slit-nozzle. The inlet flow is 250 LPM and particles are concentrated into a 10 LPM outlet flow. Major flows represent unconcentrated air being removed by the pumps. Flow settings of the PFPC are monitored by three pressure readings against atmosphere. (b) Horizontal configuration of the PFPC, and (c) vertical configuration of the PFPC. Air flows through the size selective inlet, either PM 10 or 2.5, then the two-stage slit nozzle concentrator. Flows are manually controlled using differential pressure gauges to monitor flow rates. The cylinder for the two optional impactors for 2.5 and 10 µm particles is in the front of the PFPC rack (right hand side) and the pressure readings on the left-hand side. A schematic with dimensions of the stages is provided in Figure S1 (online supplemental information).
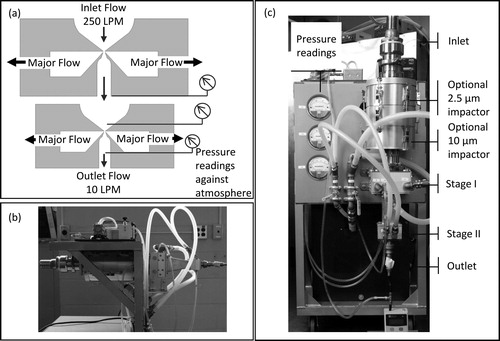
Figure 2. Schematic of the flow setup at the Sphinx Observatory for measurements of different INP and particle instruments downstream of the PFPC and the total aerosol inlet.
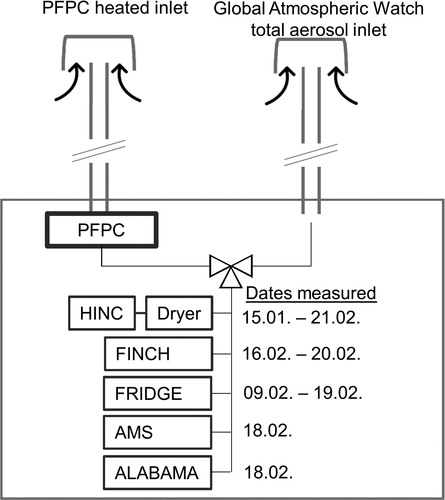
Figure 3. Measured particle EFs for the horizontal and vertical configuration of the PFPC. At Jungfraujoch only the horizontal configuration was available, where characterization measurements at Toronto were taken in both horizontal and vertical configurations. Data obtained from SMPS measurements (mobility diameter) are represented with open symbols and data from OPC measurements (optical diameter) are shown by filled symbols. The horizontal position of each point is the mid-point of the particle diameter bin analyzed. The error bars are standard error of the mean, i.e., one standard deviation. The systematic uncertainty is likely 14%, as calculated from estimated errors in the particle concentrations.
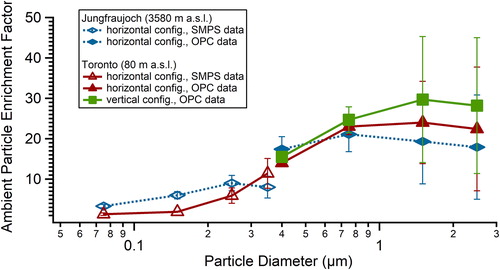
Figure 4. INP EFs determined from measurements with the HINC, FRIDGE, and FINCH instruments plotted against the calculated cumulative fraction (CF300-579) obtained for 579 nm particles from the OPS data. The CF is the fraction of the number size distribution that is smaller than the size specified. For example, a CF300-579 of 0.9 indicates that 90% of the particles for that measurement were 579 nm in diameter or smaller (but larger than 300 nm, the lower size limit of the OPC).
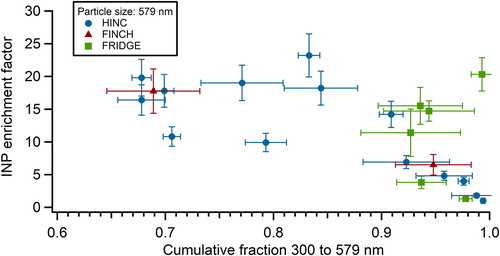
Figure 5. Average enrichment factors for the organic and sulfate components of particles measured with the C-ToF-AMS.
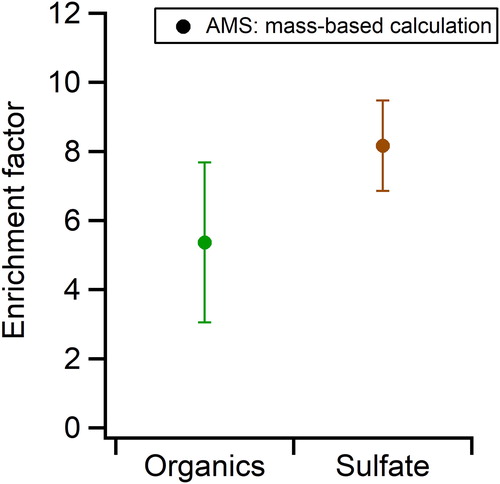
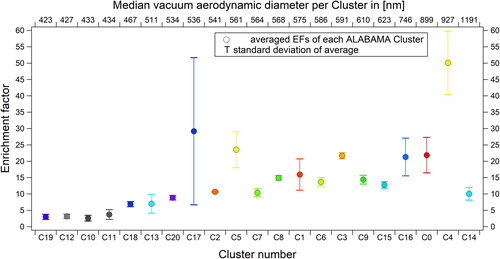
Figure 6. Enrichment factors measured for individual particle types (clusters) by the ALABAMA instrument. The clusters are ordered according to their median particle diameter from smallest to largest. The size distribution for the clusters is given in Figure S9 in the SI which uses the same colors to identify the clusters; please find the color coded version of this figure in the online version of this publication.
Supplemental Material
Download MS Word (685.7 KB)Data availability
Figure source data for this publication have been deposited in the University of Toronto Dataverse (https://doi.org/10.5683/SP2/DGS2TT).