Figures & data
Figure 1. Schematic of laboratory-scale paper production process based on the Japanese Industrial Standard JIS-P8222 (Citation2005).
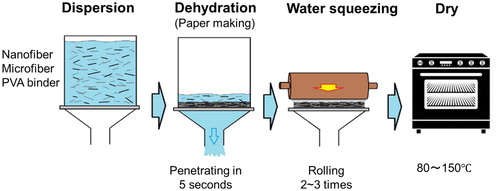
Table 1. Nanofiber geometrical properties.
Figure 2. SEM micrograph of NF-a (30%)/MF composite filter.
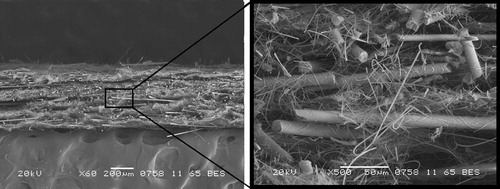
Figure 3. Experimental setup for measuring the pressure drop and penetration of the test filter (DMA: differential mobility analyzer, CPC: condensation particle counter, and MFC: mass flow controller).
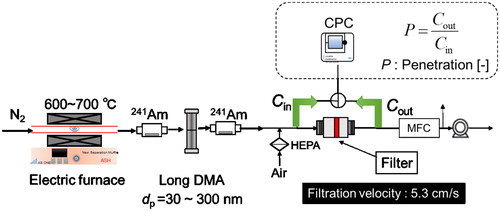
Figure 4. Pressure drops of the tests filters as a function of mixing fraction.
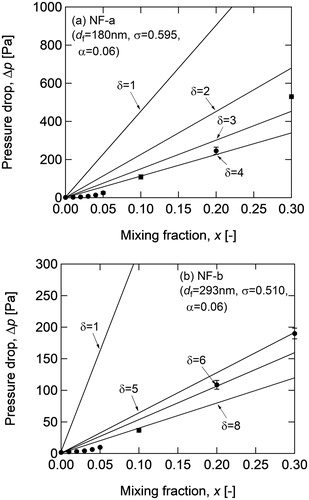
Table 2. Pressure drop and inhomogeneity factor of the mixed filter (α = 0.06, u = 0.053 m s−1).
Figure 5. Penetration of the nanofiber mixed filters, (a) NF-a and (b) NF-b, as a function of particle diameter. The inhomogeneity factor of the fiber packing (δ) was used to calculate the theoretical curves (solid lines).
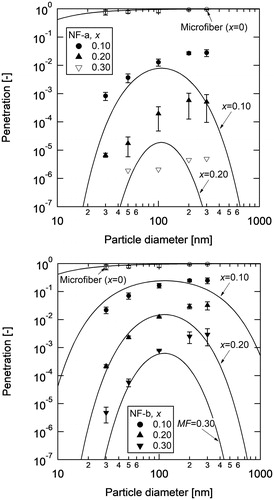
Figure 6. Calculated quality factor of the NF/MF mixed filter as a function of NF diameter. Dispersion of fiber diameter, σ, and inhomogeneity of the fiber packing, δ, were set to 0 and 1, respectively.
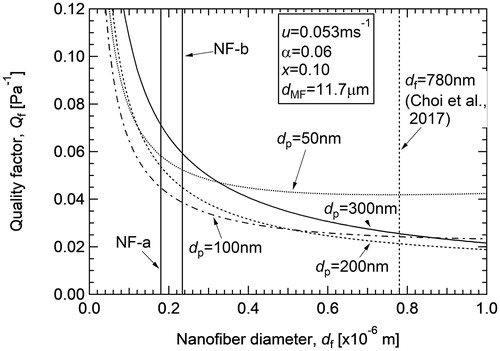
Figure 7. Comparison of the experimental and theoretical quality factor values of the nanofiber mixed filters, (a) NF-a and (b) NF-b, as a function of particle diameter. The inhomogeneity factor of the fiber packing, δ, was set to 1 for the calculations.
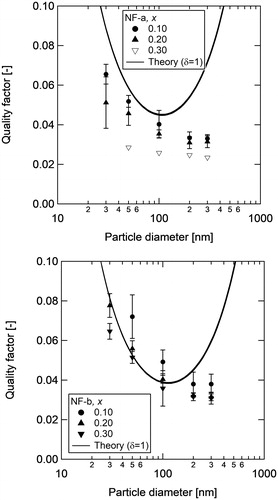
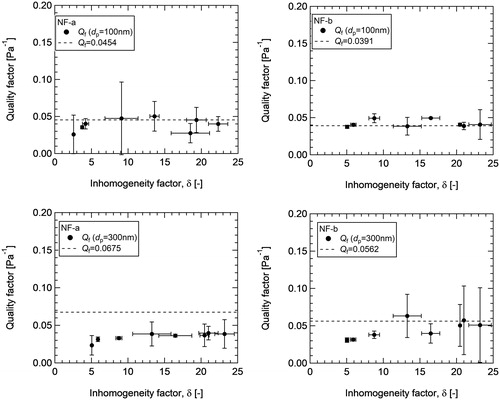
Figure 8. Quality factor (Qf) of the NF/MF mixed filters plotted against inhomogeneity factor of the fiber packing (δ). The broken lines show the theoretical values of Qf.