Figures & data
Figure 1. (a) Schematic of condensational particle growth in DAVID. Four growth tubes each with one jet are shown in the schematic for simplicity, though there are eight tubes with four jets each. (b) Custom ALI cell culture, and (c) exposure dishes to interface in DAVID.
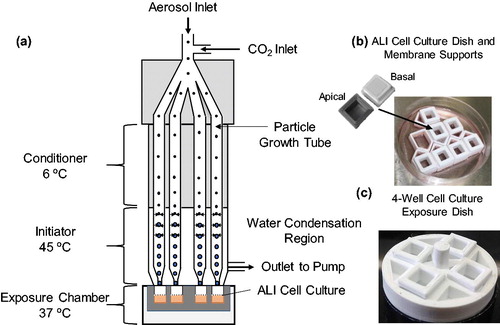
Figure 2. Schematic diagram of the testing setup used to assess the mass deposition of nanoparticles on membrane supports in DAVID by fluorescence. Uranine aerosol droplets are generated by a nebulizer, dried to nanoparticles, and deposited on membrane supports by condensational particle growth in DAVID.
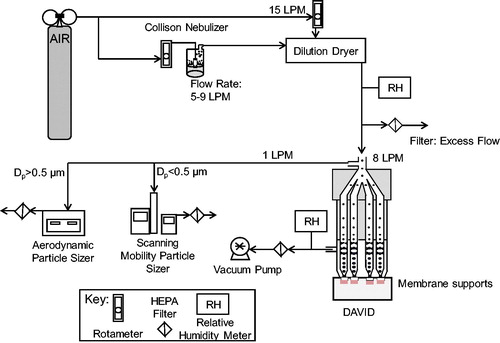
Table 1. Count mean and median diameters of the droplets exiting the nebulizer (before dilution drier) and after condensational growth at operational flow rates of 4–8 LPM as measured by Aerodynamic Particle Sizer.
Table 2. Test aerosol production settings for the Collison nebulizer and dilution dryer and the product properties (particle concentration, count mean and median particle diameters, geometric standard deviation [GSD], mass median diameter, and diameter of average mass).
Figure 3. Mass deposition on membranes determined by fluorescence for operational flow rates in DAVID of (a) 4 LPM, (b) 6 LPM, and (c) 8 LPM at the three nanoparticle concentrations, and for the (d) low (e) medium, and (F) high particles concentrations for the three operational flow rates tested. In all of the graphs, the non-black markers are the mean of the four membranes in the experimental trial, and the black markers represent the mean of the replicate experimental trials with error bars representing the standard error. An example of deposition of the uranine droplets on the membranes in the exposure dish is overlaid in (d).
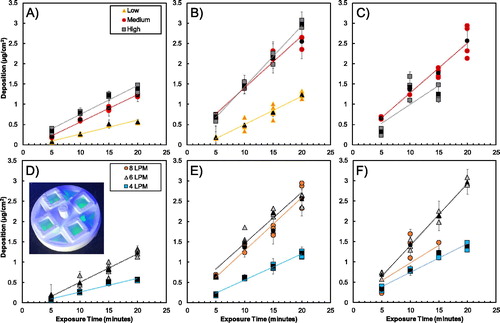
Table 3. The average coefficients of variation (CoV) of the replicate trials for the low (L), medium (M), and high (H) aerosol conditions and three operational flow rates at four exposure times.
Figure 4. Count and mass particle size distributions of the fluorescent test aerosol from nebulizer under three flow conditions with constant 15 LPM dilution drying air. Flow rates for nebulization at low, medium, and high conditions were 5 LPM, 7 LPM, and 9 LPM, respectively. The different nebulizer flow rates produced aerosol concentrations of 62,000, 130,000, and 210,000 particles/cm3. Circular markers represent the count and other shapes represent the mass size distributions, respectively. Error bars represent standard deviation of eight SMPS scans.
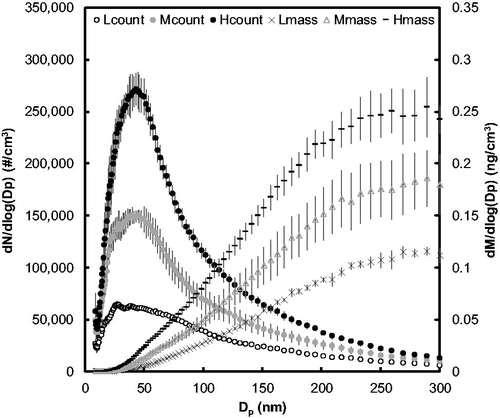
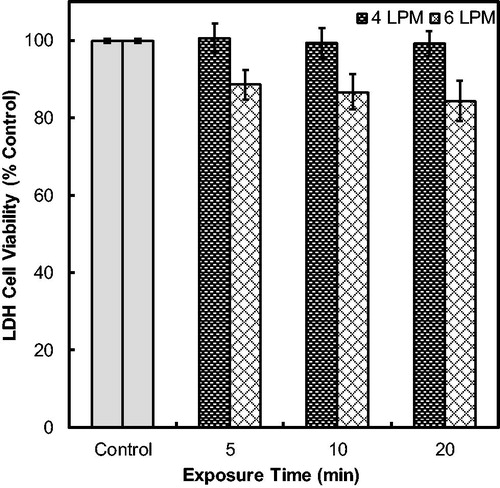
Figure 5. Lactate dehydrogenase (LDH) viability assessment of cells exposed to clean HEPA filtered air at 4 and 6 LPM operational flow rates in DAVID and with no flow (control). Error bars represent the standard error for an n = 3.