Figures & data
Figure 1. Schematic diagram of the (a) setup for collecting from rice-straw smoldering smoke inside a fume-hood and (b) collected
on 47 mm QMA filter paper. The detail of the setup is given in subsection 2.1.
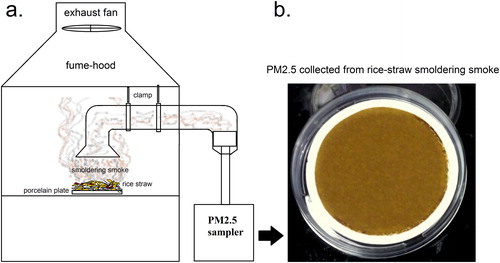
Figure 2. Changes in light absorptivity of water-soluble organic-carbon (WSOC) from rice straw smoldering due to heterogeneous photochemical aging. (a) Absorption spectra of fresh and irradiated WSOC. Wavelength dependent mass absorption coefficients (MAC) are plotted along the y-axis and corresponding wavelengths are plotted along the x-axis. The inset summarizes the absorption Ångström exponents (AAE) and OC mass concentrations () of the fresh and each of the irradiated samples. The AAE values were calculated by using EquationEquation (4)
(4)
(4) . (b) Linear fits of lnMAC(λ) in the 280–400 nm and 400–500 nm intervals and at 365 nm are plotted against corresponding irradiation times to determine the photo-bleaching rate constant. Error bars represent standard deviations of three individual experimental values.
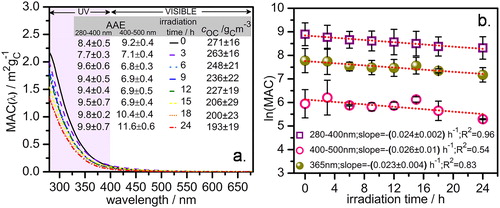
Figure 3. Wavelength dependent variation of the relative quantum efficiency (, in the y-axis) of the water-soluble organics in
from rice-straw smoldering smoke. The
values were calculated using EquationEquation (6)
(6)
(6) and data from Figure S4. The error bars represent standard deviations calculated from three individual experiments.
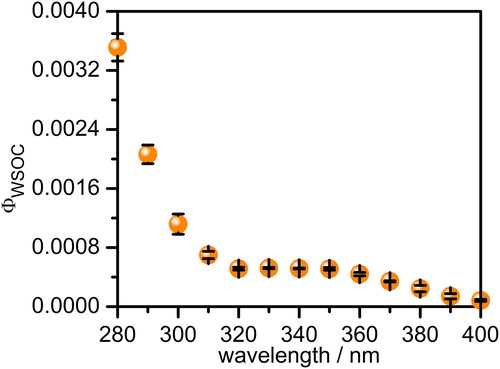
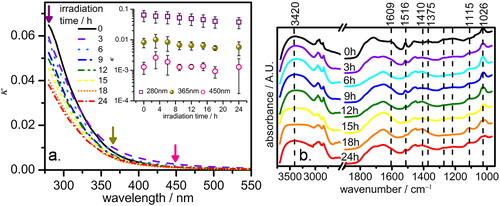
Figure 4. (a) Plot of the imaginary part of refractive index (κ) along the y-axis against corresponding wavelengths along the x-axis. The downward arrows indicate the representative wavelengths of which the κ values are plotted in the inset figure; Inset: Decay of κ (in log scale) with irradiation time. Error bars represent standard deviations of three individual experimental values. (b) FTIR spectra of fresh and aged water-soluble organic-carbon.